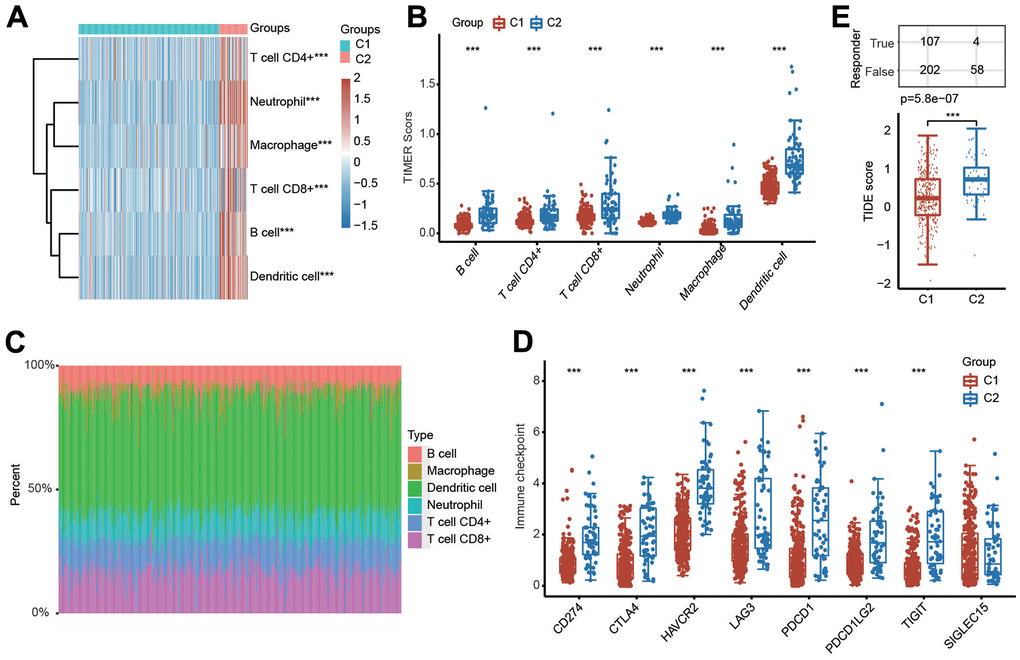
Figure 4.Evaluation of immune cell infiltration abundance in different clusters of HCC samples by the TIMER algorithm. (A, B) Heatmap and box diagram showing the differential infiltration abundance of six types of immune cells in C1 and C2. (C) Bar plot demonstrating the composition of a great variety of immune cells in every HCC patient from C1 and C2 analyzed by the TIMER algorithm. (D) Box plots indicating the altered expression of immune checkpoint genes in C1 and C2. (E) Box plots showing the TIDE scores in the two clusters. ***p < 0.001.