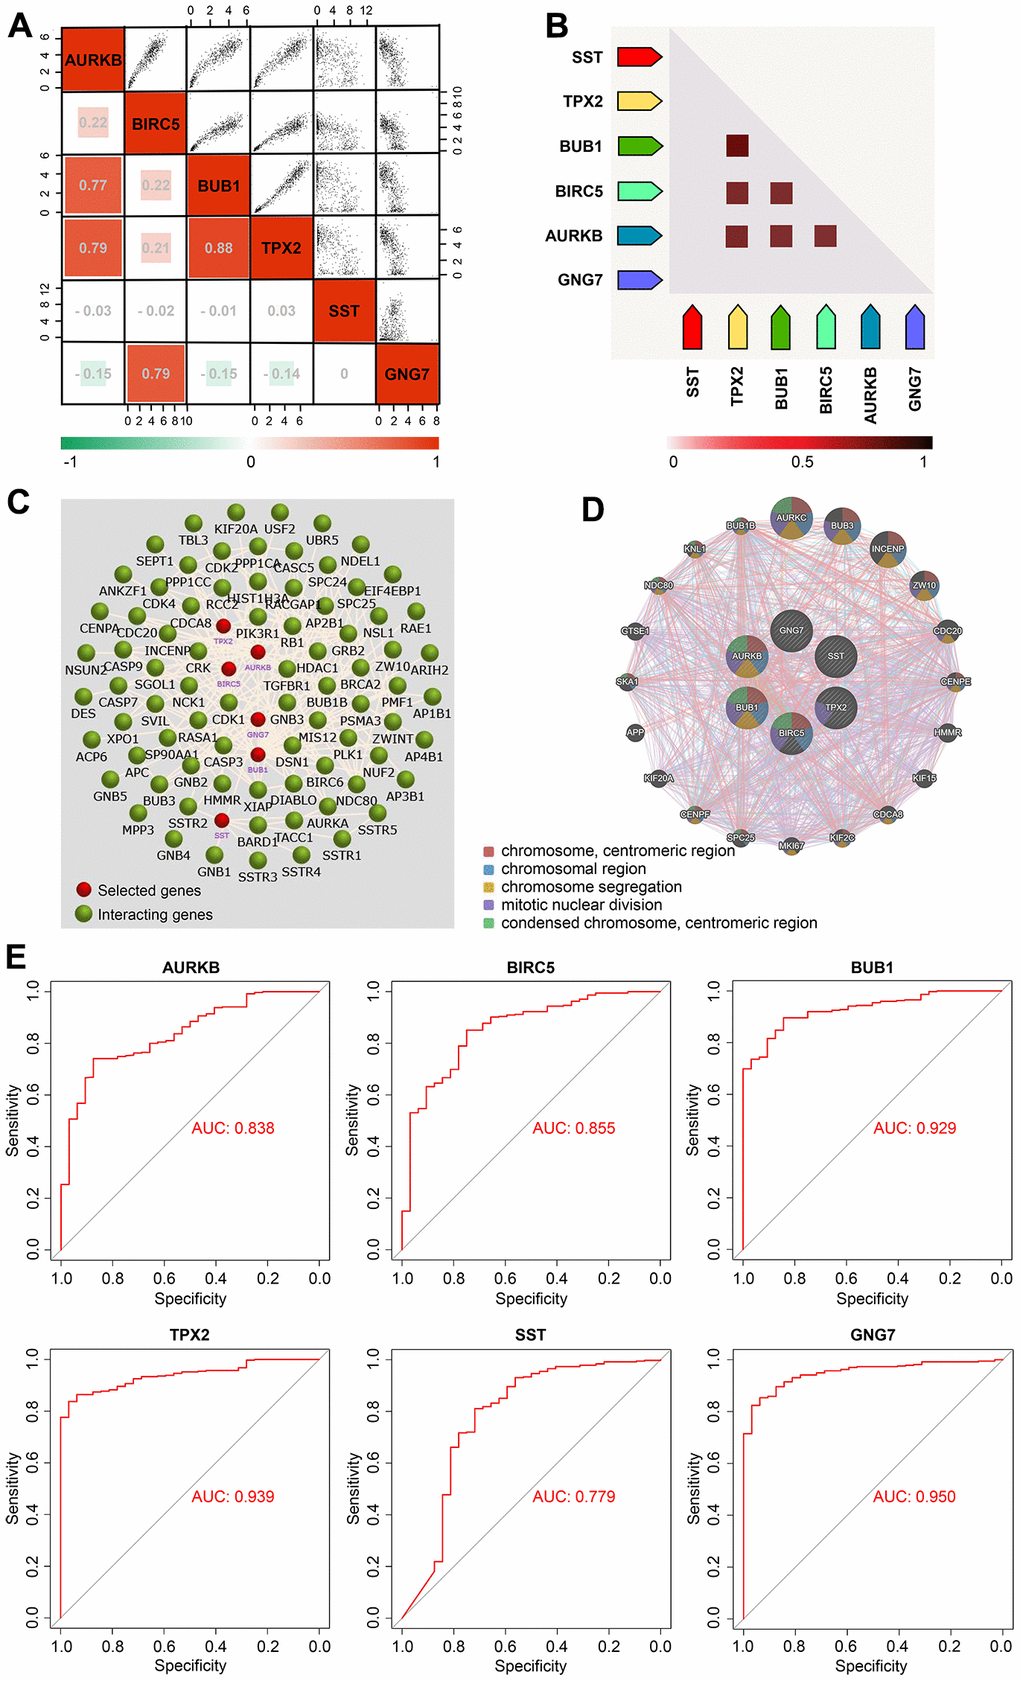
Figure 6.Correlation and diagnostic value analyses of the signature genes in GC. (A) Correlation heatmap of the six signature genes in GC presented using the GEPIA2 database. (B) Coexpression heatmap of the six signature genes in GC visualized via the STRING database. (C) Interaction network of the six signature genes and their related genes created using the FunRich software. (D) PPI network of the six signature genes and their coexpression genes obtained via GeneMANIA. (E) ROC curves of the six signature genes in the TCGA-STAD cohort constructed using the bioinformatics platform (http://www.bioinformatics.com.cn). AUC, area under curve; GC, gastric cancer; GEPIA, Gene Expression Profiling Interactive Analysis; PPI, protein–protein interaction; ROC, receiver operating characteristic; STAD, stomach adenocarcinoma; STRING, Search Tool for the Retrieval of Interacting Genes; and TCGA, The Cancer Genome Atlas.