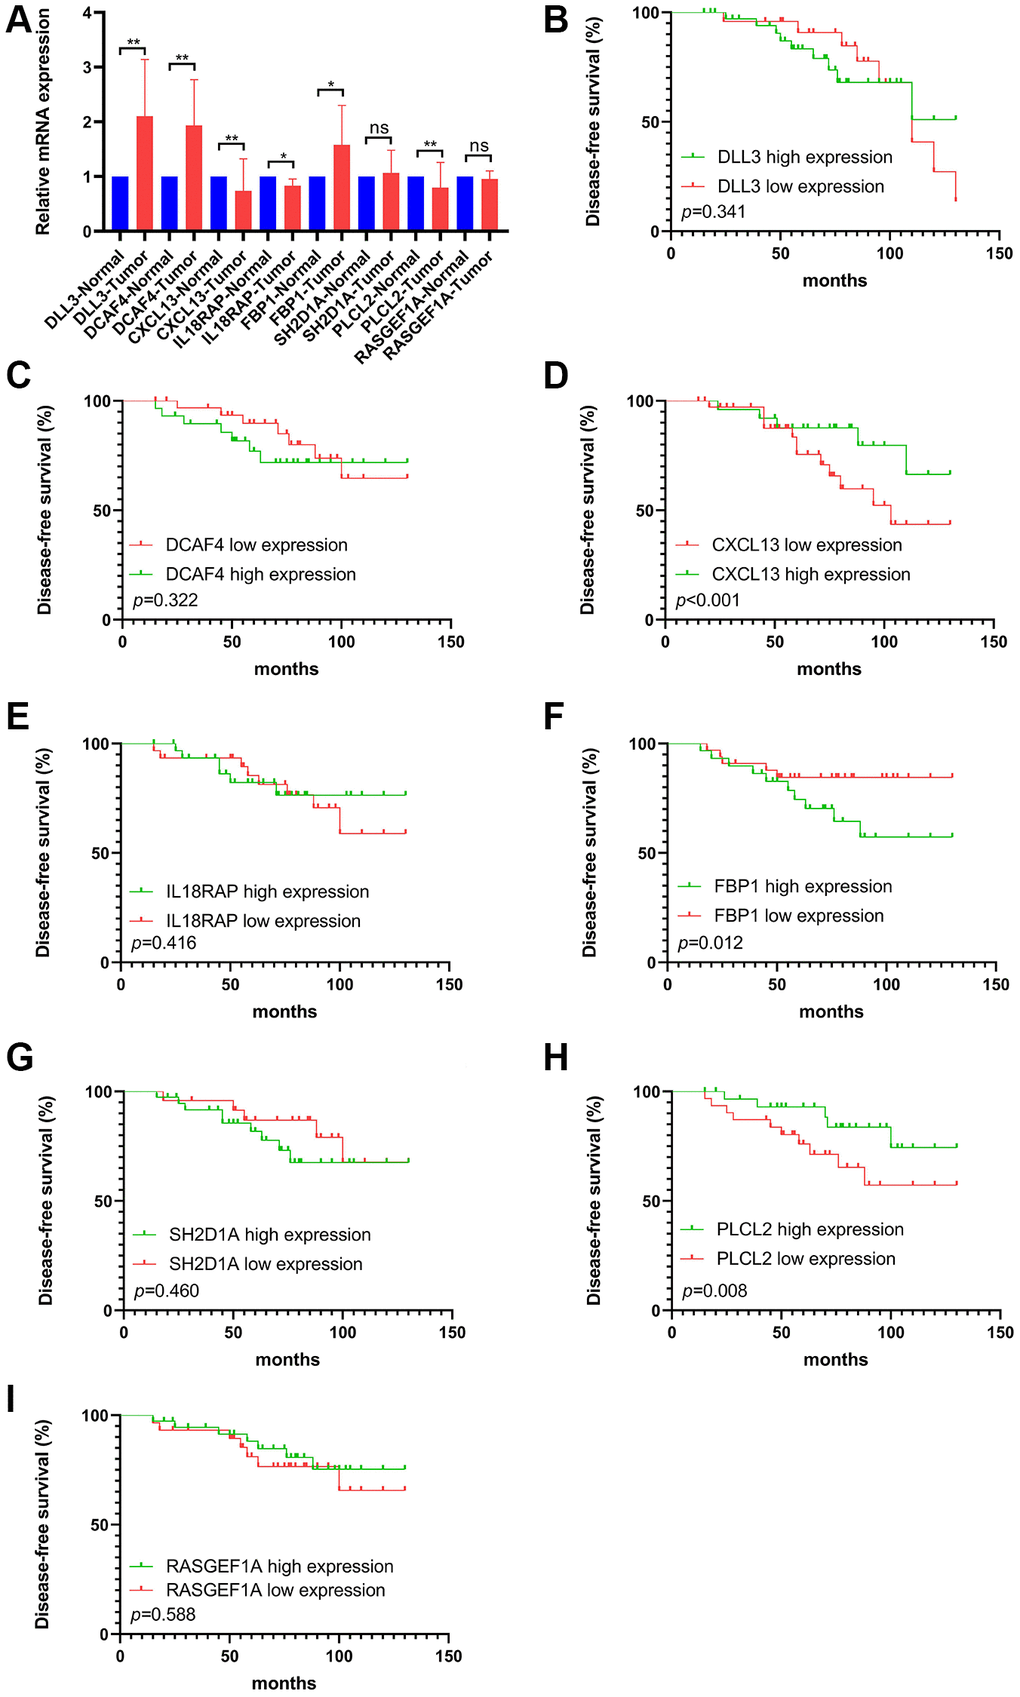
Figure 9.The mRNA levels and prognostic value of selected FS gene signatures in our cohort. (A) Comparison of mRNA expression levels of selected FS gene signatures in adjacent normal tissues and Tumor tissues by RT-qPCR assay. Kaplan–Meier curve shows the survival diversity between differential expression of DLL3 (B), DCAF4 (C), CXCL13 (D), IL18RAP (E), FBP1 (F), SH2D1A (G), PLCL2 (H) and RASGEF1A (I) in our cohort. Non-significant (ns) P > 0.05, *P < 0.05, **P < 0.01.