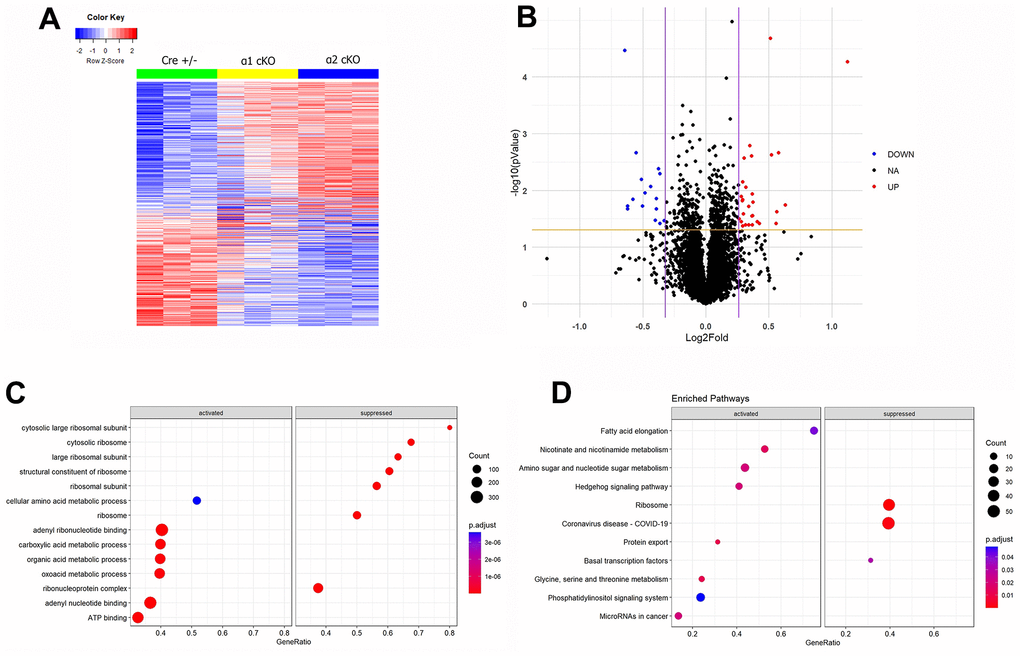
Figure 6.Mass spectrometry (MS)-based proteomics analysis reveals distinct alterations of protein expression levels associated with suppression of the neuronal AMPKα isoform in aged mice. (A) A heat map generated from the MS proteomics data showed the differentially newly synthesized proteins (667 proteins) across the three experimental groups. (B) A volcano plot showed the fold changes of protein expression in AMPKα2 cKO vs AMPKα1 cKO mice. Red dots represent those significantly upregulated proteins (29 proteins). Blue dots represent those significantly downregulated proteins (16 proteins). Black dots represent the proteins whose expression levels were not significantly different between the AMPKα1 cKO and AMPKα2 cKO mice. (C) Gene Ontology (GO) analysis of the differentially regulated proteins in AMPKα2 cKO vs AMPKα1 cKO mice. (D) Gene Set Enrichment Analysis (GSEA) of differentially regulated proteins in AMPKα2 cKO vs AMPKα1 cKO mice. All proteomics analysis was performed with the R program. Heat map and volcano plot were generated with ggplot2 package (version 3.3.5) in R (version 4.1.2). GO analysis and GSEA were done with clusterProfiler package (version 4.2.2) in R (version 4.1.2).