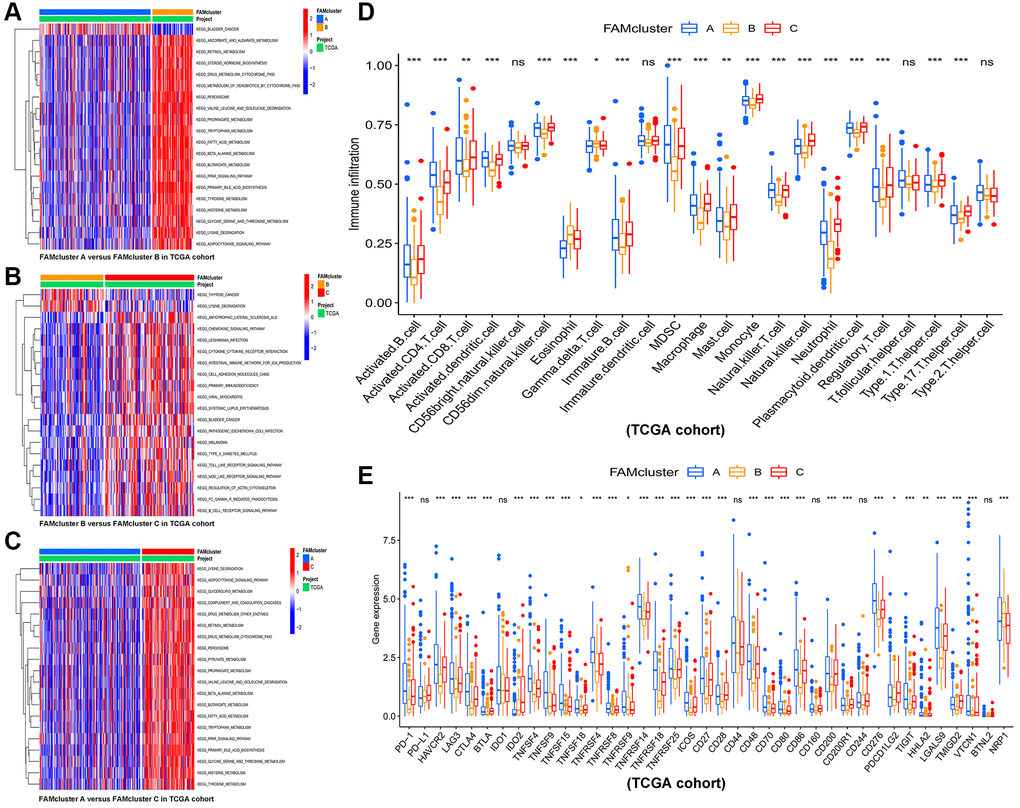
Figure 3.The results of GSVA and immune infiltration analysis in three clusters. GSVA results of biological pathways between: (A) cluster A vs. cluster B, (B) cluster B vs. cluster C, and (C) cluster A vs. cluster C, red and blue represent activated and inhibited pathways, respectively. (D) The infiltration levels of 23 immune cells in the three FAM clusters. (E) Significant differences in expression of immune checkpoint in the three FAM clusters. Abbreviations: GSVA: gene set variation analysis; FAM: fatty acid metabolism. *p < 0.05; **p < 0.01; ***p < 0.001.