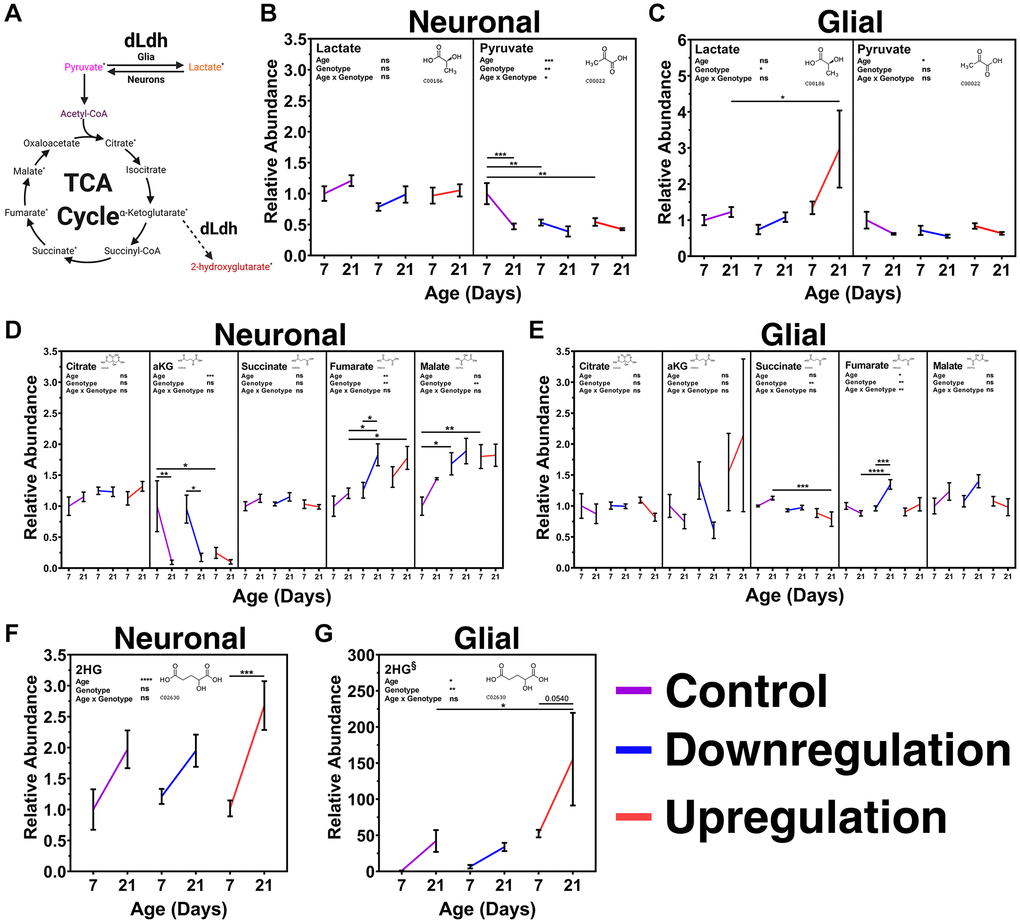
Figure 5.Metabolite analysis of transgenic male fly heads aged 7 and 21 days with altered expression of neuronal or glial dLdh revealed alterations in lactate, pyruvate, TCA cycle intermediates, and 2HG levels relative to control flies. (A) Metabolic pathway connections with metabolites produced by dLdh canonical [Pyruvate ↔ Lactate] and non-canonical [αKG→2HG] activity. Metabolites measured by gas chromatography-mass spectrometry (GC-MS) in the heads of transgenic male flies aged 7 and 21 days at 29°C are denoted by a superscript asterisk. (B) Neuronal dLdh manipulation does not impact lactate levels whereas pyruvate levels are reduced at 7 days of age nearly to the level of 21 days of age by both upregulation and downregulation. (C) Glial dLdh upregulation caused an increase in lactate but no effect on pyruvate levels. (D) Neuronal dLdh manipulation promotes alterations in select TCA cycle intermediates. Upregulation of dLdh lowered α-ketoglutarate (αKG) levels. Downregulation and upregulation of dLdh raised fumarate and malate levels. (E) Glial dLdh manipulation caused only slight alterations in TCA cycle intermediates. Citrate, αKG, and malate levels were unaltered. Upregulation of dLdh lowered succinate levels. Downregulation of dLdh raised fumarate levels at 21 days of age. (F) 2-hydroxyglutarate (2HG) levels are generally increased with age without any clear change due to neuronal dLdh manipulation. (G) The age-related increase in 2HG is exacerbated by glial dLdh upregulation but not by downregulation. Comparisons for each metabolite were done between genotype and age groups of neuronal and glial dLdh transgenic flies separately using two-way ANOVAs with Dunnet’s multiple comparisons with control for each age group and with Šídák’s multiple comparisons between age groups within each genotype. Effects of age, genotype, and age by genotype interaction are denoted on the top left of each graph. The structural formula for each metabolite were obtained from the Kyoto Encyclopedia of Genes and Genomes (KEGG) chemical compound database with associated C number below.