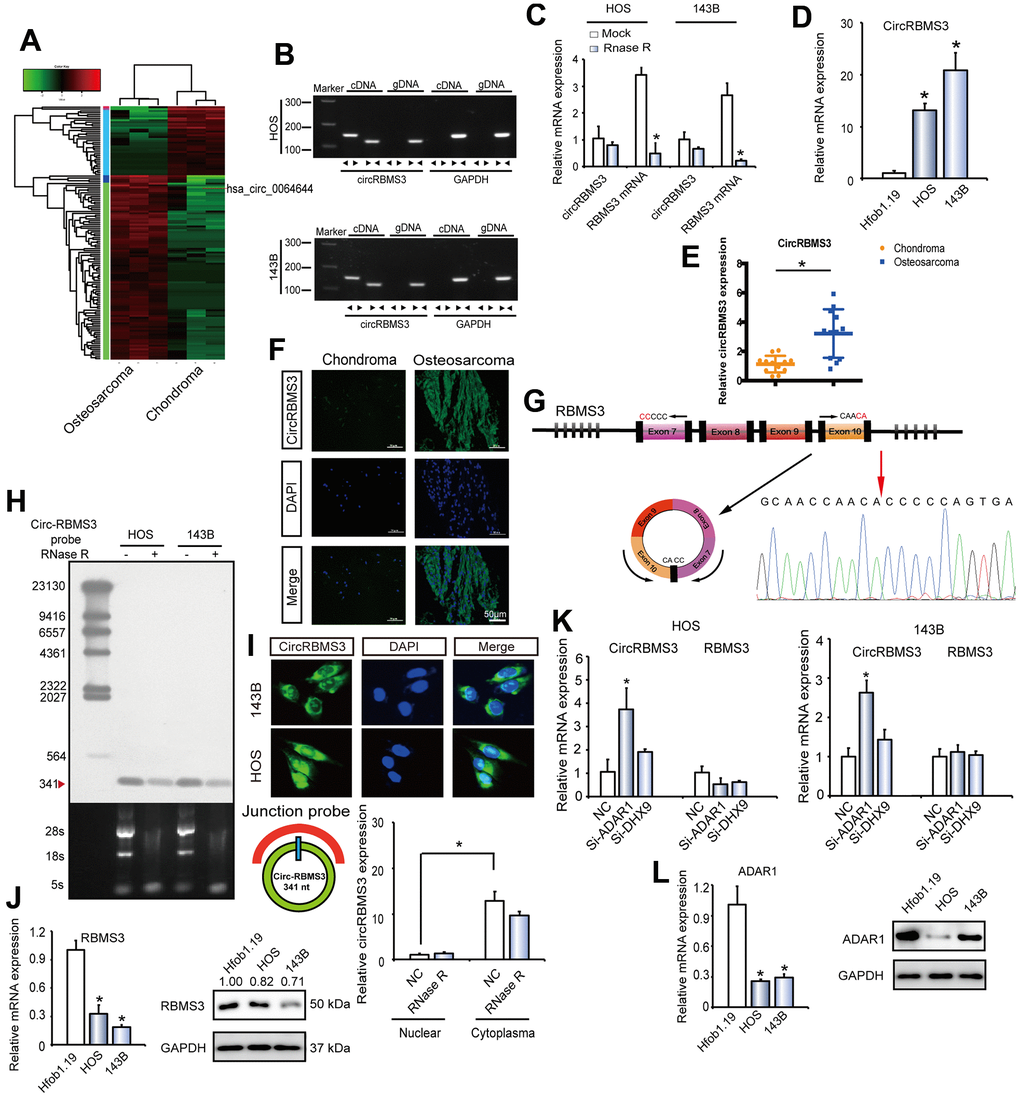
Figure 1.circRBMS3 validation and expression in OS tissue and cells. (A) Heat map of all differentially expressed circRNAs between chondroma and OS tumor tissues. (B) The presence of circRBMS3 was validated in HOS and 143B OS cell lines by RT–qPCR. Divergent primers amplified circRBMS3 in cDNA, but not in genomic DNA. GAPDH was used as a negative control. (C) The expression of circRBMS3 and RBMS3 mRNA in HOS and 143B cells treated with or without RNase R was detected by qPCR. The relative levels of circRBMS3 and RBMS3 mRNA were normalized to the value measured in the mock treatment. Data represent the mean ± SD (n = 3). * P < 0.05. (D) CircRBMS3 expression in hFOB1.19 and OS (OS) cell lines (HOS and 143B) was evaluated by RT-qPCR. Data represent the mean ± standard deviation (SD) (n = 3). * P < 0.05 (E) CircRBMS3 expression was higher in human OS than in chondroma tissue. Data represent the mean ± SD (n = 12). * P < 0.05. (F) CircRBMS3 expression was higher in human OS than in chondroma tissue. Representative images are shown (400 × magnification). (G) Schematic illustration showing RBMS3 exon 7–10 circularization forming circRBMS3 (black arrow). The presence of circRBMS3 was validated by RT–qPCR, followed by Sanger sequencing. Red arrow represents “head-to-tail” circRBMS3 splicing sites. (H) Northern blots for detecting circRBMS3 in HOS and 143B cells treated with or without RNase R digestion. The upper panels show the probed blots of circRBMS3, and the red triangle represents the circRBMS3 band size (341 bp). The lower panels show the gel electrophoretic results of RNA with or without RNase R digestion. (I) RNA fluorescence in situ hybridization (FISH) showed that circRBMS3 was predominantly localized in the cytoplasm. CircRBMS3 probes were labeled with Alexa Fluor 488. Nuclei were stained with DAPI. Scale bar, 50 μm. Upper panel: FISH with junction-specific probes indicates the cellular localization of circRBMS3. Scale bars = 5 μM. Lower panel: circRBMS3 was detected in different cell fractions. Nuclear and cytoplasmic RNA was extracted, and junction primers were used for circRBMS3 detection. U6 was used as an internal control of nuclear RNA, and GAPDH was used as internal control for cytoplasmic RNA. Values are the average ± SD of 3 independent experiments. (J) RBMS3 expression in hFOB1.19 and OS (OS) cell lines (HOS and 143B) was evaluated by WB and RT-qPCR. Data represent the mean ± standard deviation (SD) (n = 3). * P < 0.05. (K) RT-qPCR for RBMS3 mRNA and circRBMS3 upon DHX9 and ADAR1 depletion using RNAi in OS cell lines. (L) ADAR1 expression in hFOB1.19 and OS cell lines (HOS and 143B) was evaluated by RT-qPCR and WB. Data represent the mean ± standard deviation (SD) (n = 3). * P < 0.05.