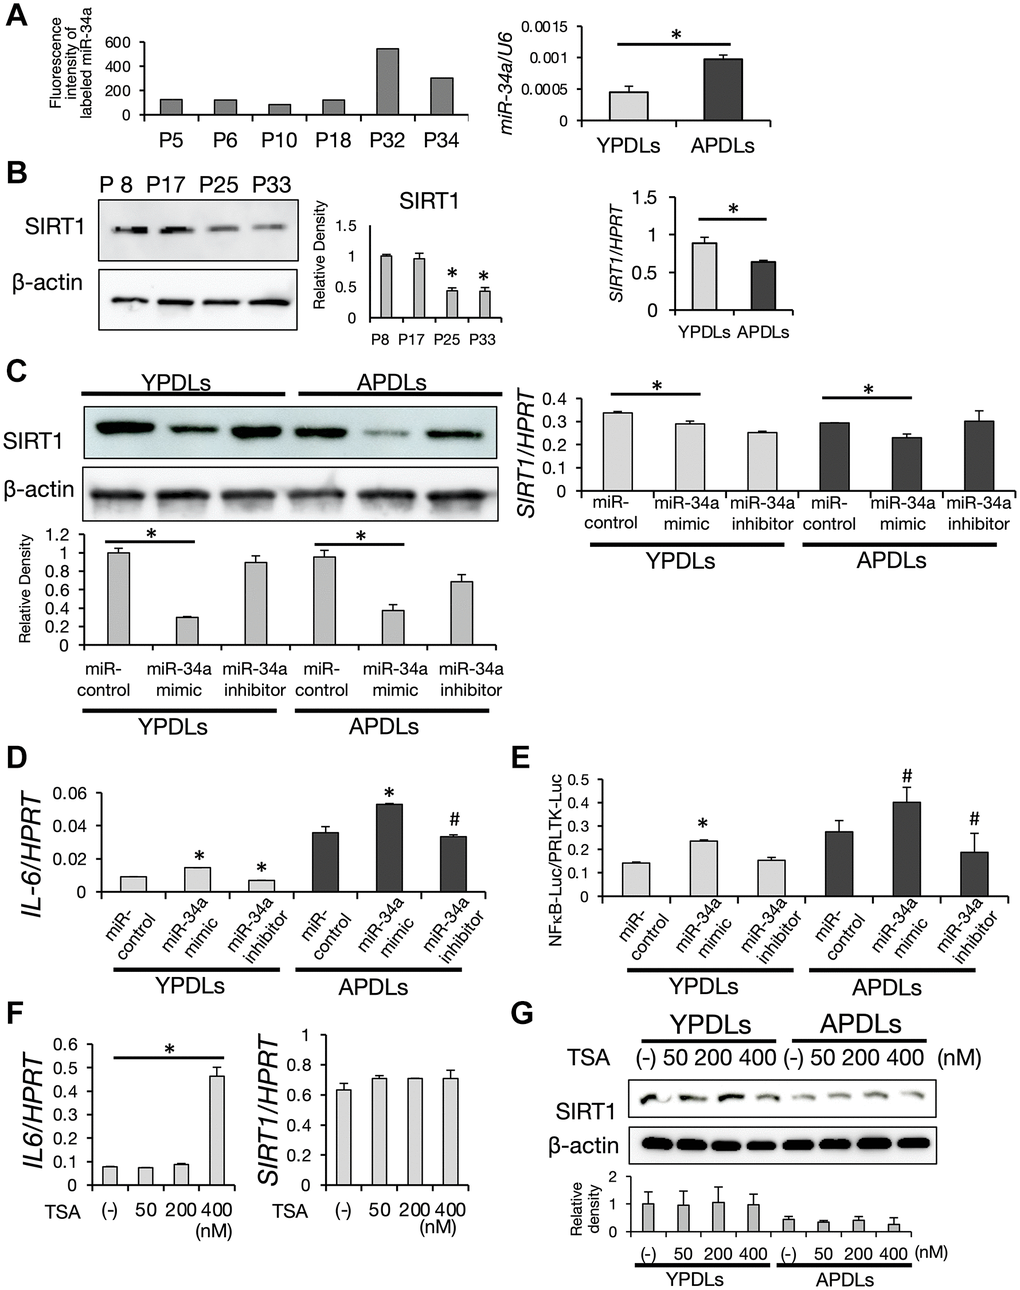
Figure 5.Increased expression of miR-34a in senescent HPDL cells. (A) Expression of miR-34a was increased depending on the passage of HPDL cells. Scores of the fluorescence intensity of labeled miR-34a in miRNA array analysis of P5, P6, P10, P18, P32, and P34 HPDL cells is displayed in the histogram. Right graph shows the expression of miR-34a in YPDLs (P6) and APDLs (P34) analyzed by qRT-PCR (*p < 0.01). (B) Decreased expression of SIRT1 in senescent HPDL cells. Expression of SIRT1 protein in P8, P17, P25, and P33 HPDL cells analyzed by western blotting. β-Actin was used as a loading control and the relative protein levels were quantified. (*p < 0.01 vs. P8) Right graph shows the expression of SIRT1 mRNA in YPDLs and APDLs measured by qRT-PCR (*p < 0.01). (C) Overexpression of miR-34a inhibited SIRT1 expression in HPDL cells. MiR-34a mimic and anti-miR-34a oligonucleotides were transfected into YPDLs and APDLs. Expression of SIRT1 protein was analyzed by western blotting. β-Actin was used as a loading control and the relative protein levels were quantified. Right graph shows the expression of SIRT1 measured by qRT-PCR. (*p < 0.01 vs. control) (D) Overexpression of miR-34a upregulated IL-6 expression in HPDL cells. Expression of IL-6 was measured by qRT-PCR (*p < 0.01, #p < 0.05 vs. control). (E) Overexpression of miR-34a upregulated NF-κB activity in HPDL cells. NF-κB transcription activity was analyzed by a luciferase reporter assay (*p < 0.01, #P < 0.05 vs. control). (F) TSA treatment induced IL-6 in YPDLs (P6). Expression of IL-6 and SIRT1 mRNA in YPDLs after TSA treatment (0, 50, 200, and 400 nM) was quantified by qRT-PCR (*p < 0.01 vs. none). (G) Expression of SIRT1 in YPDLs and APDLs after TSA treatment (0, 50, 200, and 400 nM). Expression of SIRT1 protein was analyzed by western blotting. β-Actin was used as a loading control and the relative protein levels were quantified. Representative data from three experiments are shown.