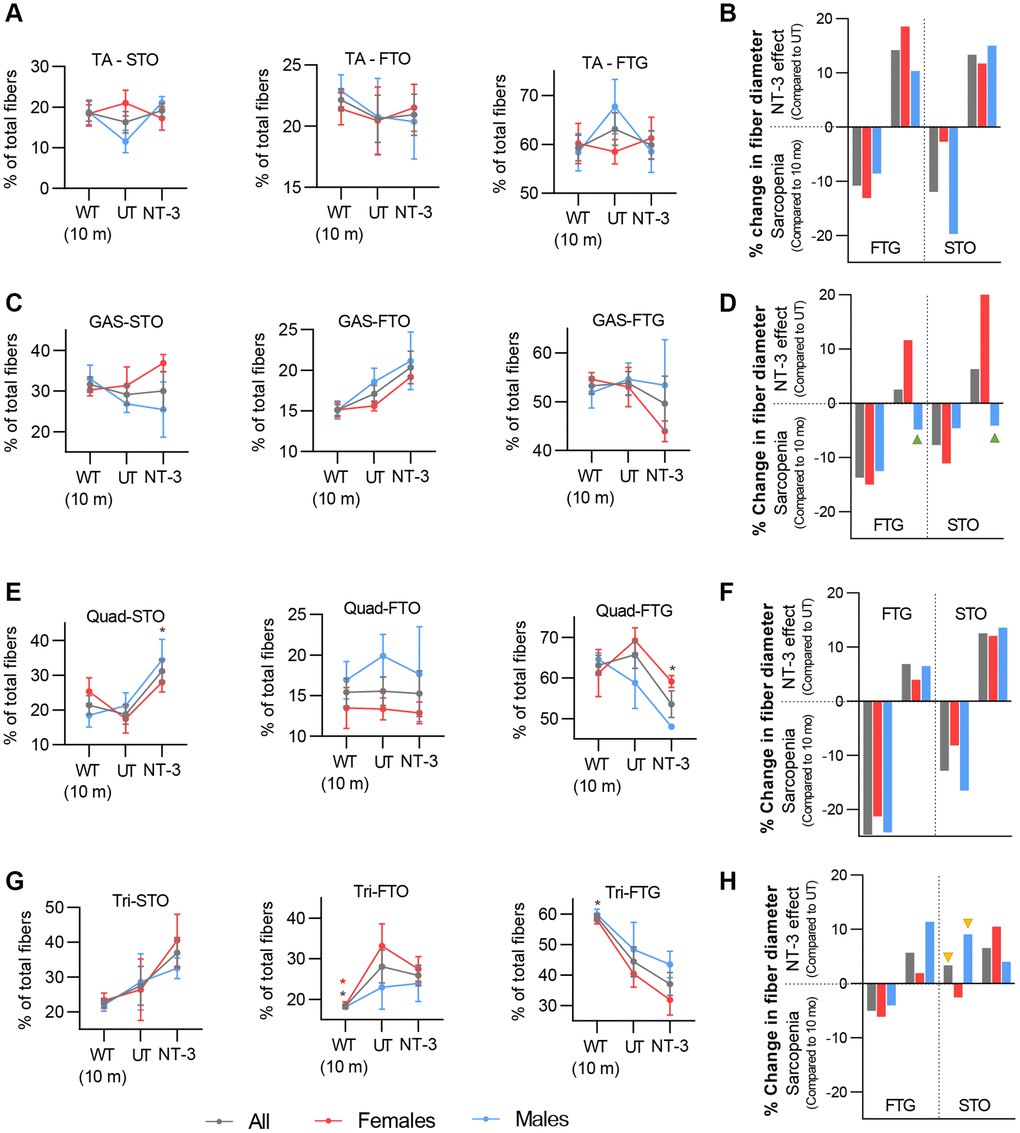
Figure 3.NT-3 effect on fiber diameter and fiber type switch. Line graphs represent the changes in fiber type contribution to total as percent (STO, FTO and FTG) in the muscles analyzed. Data are represented as mean ± SEM. Bar graphs represent percent changes in average fiber diameter of sarcopenic mice compared to 10-month-old mice to show age-related fiber size changes, and NT-3-treated mice compared to untreated 2-year-old mice to show the effect of treatment in average fiber size change. Mean fiber size is calculated for each cohort and percent change is determined based on these mean fiber size values for each muscle. Green arrow heads mark bars for treated mice showing no fiber size increase, yellow arrow heads depicting bars for untreated mice did show fiber size increase compared to 10-month- old mice, likely as compensatory change. (A, B) Tibialis anterior (UT, n = 8; NT-3, n = 9; WT, n = 8; with equal sex distribution), (C, D) gastrocnemius (UT, n = 6; NT-3, n = 6; WT, n = 8; with equal sex distribution) (E, F) quadriceps (UT, n = 6; NT-3, n = 4; WT, n = 7; with equal sex distribution) and (G, H) triceps (UT, n = 8; NT-3, n = 9; WT, n = 8; with equal sex distribution) muscles from 10-month-old mice, UT cohort and treatment cohort, shown as sexes combined (grey) and separated (red: females, blue: males). Two-way ANOVA, Tukey’s multiple comparisons test. Data is represented as mean ± SEM; *p < 0.05, **p < 0.01, ***p < 0.001, ****p < 0.0001 showing only comparison to UT cohort.