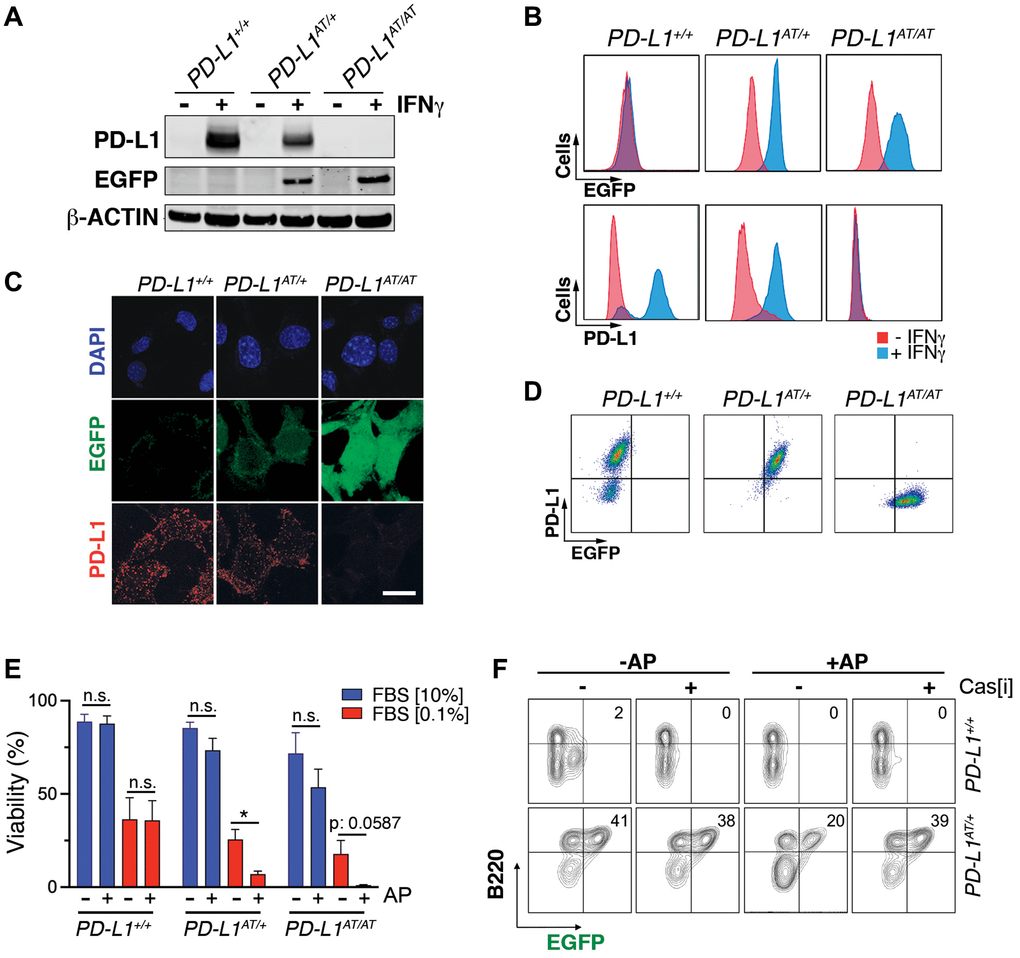
Figure 2.In vitro validation of the PD-L1ATTAC mouse model. (A) Western blot illustrating PD-L1 and EGFP expression in PD-L1+/+, PD-L1AT/+ and PD-L1AT/AT MEFs exposed or not to IFNγ (100 ng/ml) for 48 hours. (B, C) Flow cytometry (B) and immunofluorescence (C) analyses of EGFP and PD-L1 expression in PD-L1+/+, PD-L1AT/+ and PD-L1AT/AT MEFs exposed to IFNγ (100 ng/ml) for 48 hours. Scale bar (white) indicates 5 μm. (D) Two-dimensional dot plot from the flow cytometry data shown in (C) illustrating the correlation between EGFP and PD-L1 expression per cell. (E) Percentage of live cells by FACS in PD-L1+/+, PD-L1AT/+ and PD-L1AT/AT MEFs cultured in normal or low-serum media (0.1% FBS) containing IFNγ (10 ng/ml) and treated or not with AP20187 (100 nM). Cells were cultured in normal or low-serum media for 24 hours. The day after, cells were exposed or not to AP20187 for 72 hours. (F) FACS analyses of B220 and EGFP expression of splenocytes from PD-L1+/+ and PD-L1AT/+ mice cultured in IFNγ (10 ng/ml), LPS (10 ng/ml) and M-CSF (10 ng/ml) for 24 hours before exposition to AP20187 (100 nM) and caspase inhibitor I (20 μM) for 24 hours. Percentage of B220+ EGFP+ cells is shown.