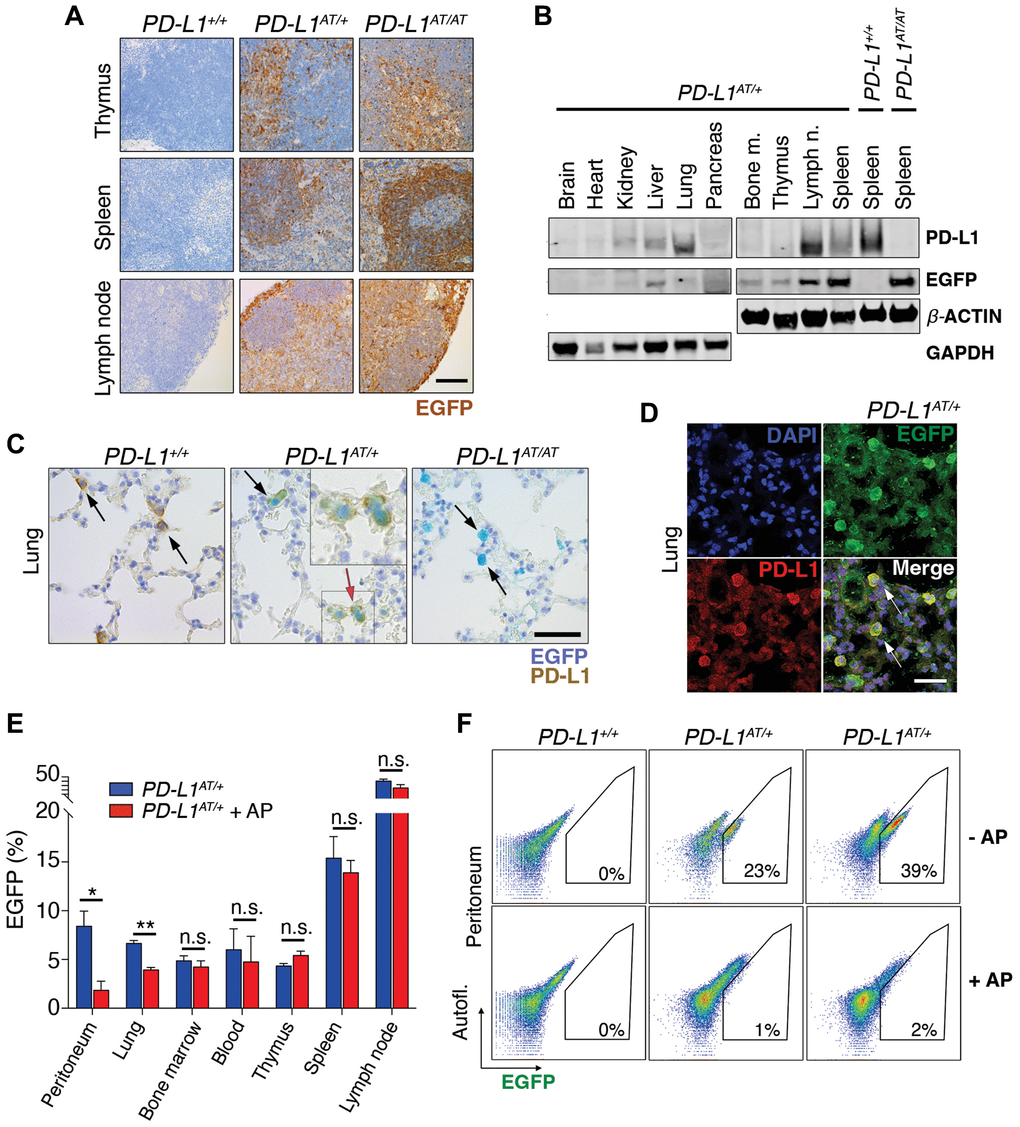
Figure 3.In vivo validation of the PD-L1ATTAC mouse model. (A) EGFP immunohistochemistry (IHC) from the thymus, spleen and lymph nodes of PD-L1+/+, PD-L1AT/+ and PD-L1AT/AT mice. Scale bar (black) indicates 100 μm. (B) Western blot illustrating PD-L1 and EGFP expression in different organs of PD-L1AT/+ mice and the spleen of wt and PD-L1AT/AT mice. Actin and GAPDH were used as a loading control. (C) Representative images from a dual PD-L1 and EGFP IHC in lungs from PD-L1+/+, PD-L1AT/+ and PD-L1AT/AT mice. Arrows indicate examples EGFP expressing cells. The red arrow in the PD-L1AT/+ panel indicates an inset that is magnified in the right-hand corner to illustrate the appearance of cells expressing both EGFP and PD-L1. Scale bar (black) indicates 50 μm. (D) Representative image from a dual EGFP and PD-L1 IF in the lung of PD-L1AT/+. Scale bar (white) indicates 30 μM. (E) Percentage of EGFP+ cells as revealed by FACS in different organs from control and AP20187 -treated (AP) PD-L1AT/+ mice. AP20187 was administered via I.P. at 2.5 mg/kg for 3 days. The p value was calculated with unpaired t-test. Abbreviation: n.s.: non-significant; *p < 0.05. *p < 0.01 (F) FACS analysis of PD-L1 expression as monitored by EGFP in peritoneal cells from PD-L1+/+, PD-L1AT/+ and PD-L1AT/AT mice treated or not with AP20187 (2.5 mg/kg) for 3 days. Percentage of EGFP+ cells is shown.