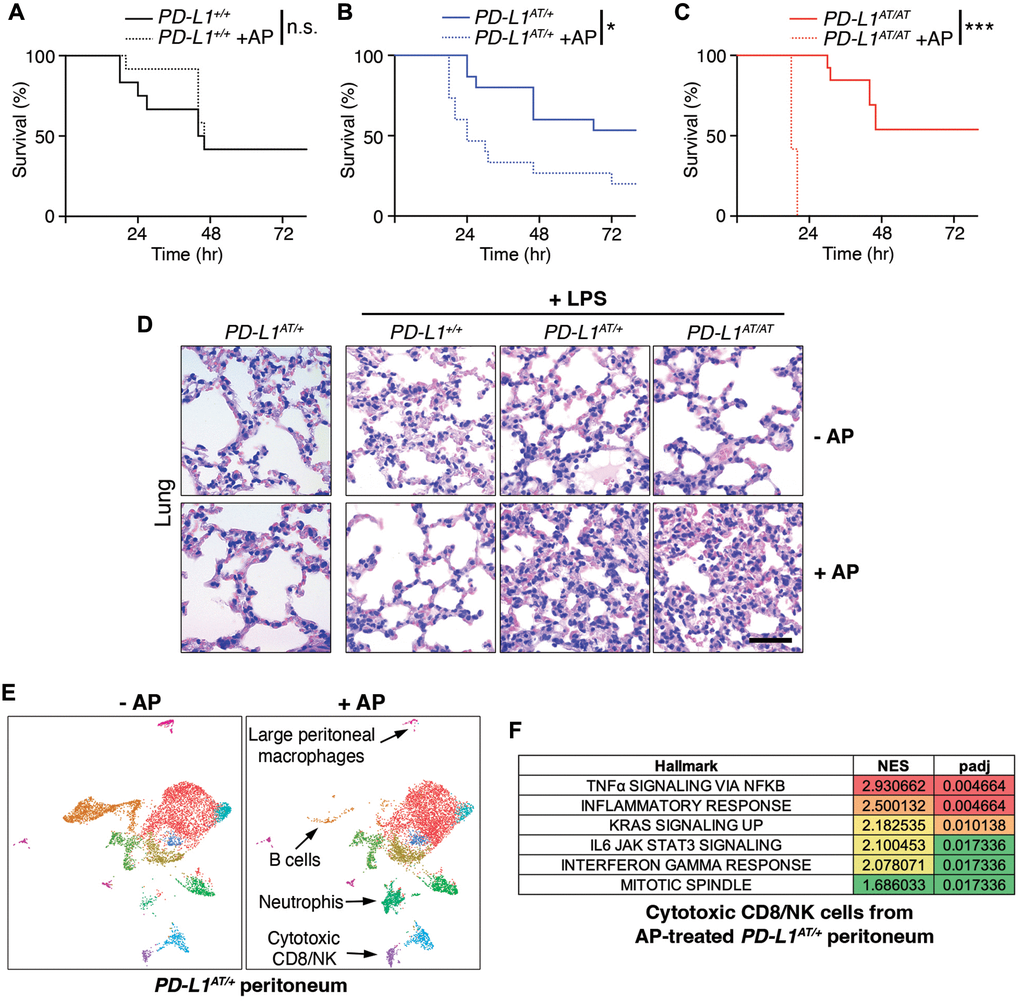
Figure 4.Effects of depleting PD-L1-expressing cells in a model of LPS-induced septicaemia. (A–C) Kaplan-Meier survival curves of PD-L1+/+, PD-L1AT/+ and PD-L1AT/AT mice after LPS injection. Mice were treated via i.p. with AP20187 (2.5 mg/kg) for 3 days and subsequently injected i.p. with 10 mg/kg LPS. The p value was calculated with the Mantel-Cox log rank test. *p < 0.05 ***p < 0.001. (D) Hematoxylin/eosin IHC in the lungs from the experiment defined in (A–C). Note the further accumulation of infiltrates in the lungs of AP20187-treated PD-L1AT/+ and PD-L1AT/AT mice after LPS injection. Scale bar (black) indicates 75 μm. (E) Single-cell sequencing analysis of the impact of AP20187 treatment (2.5 mg/kg, 3 days) on the repertoire of peritoneal cells from PD-L1AT/+ mice. Panels show UMAP plots from these analyses are shown and the cell types showing alterations are indicated by arrows. (F) GSEA analysis showing the hallmarks that were most significantly upregulated in cluster 9 (cytotoxic CD8/NK cells) after AP20187 treatment from the experiment defined in (E).