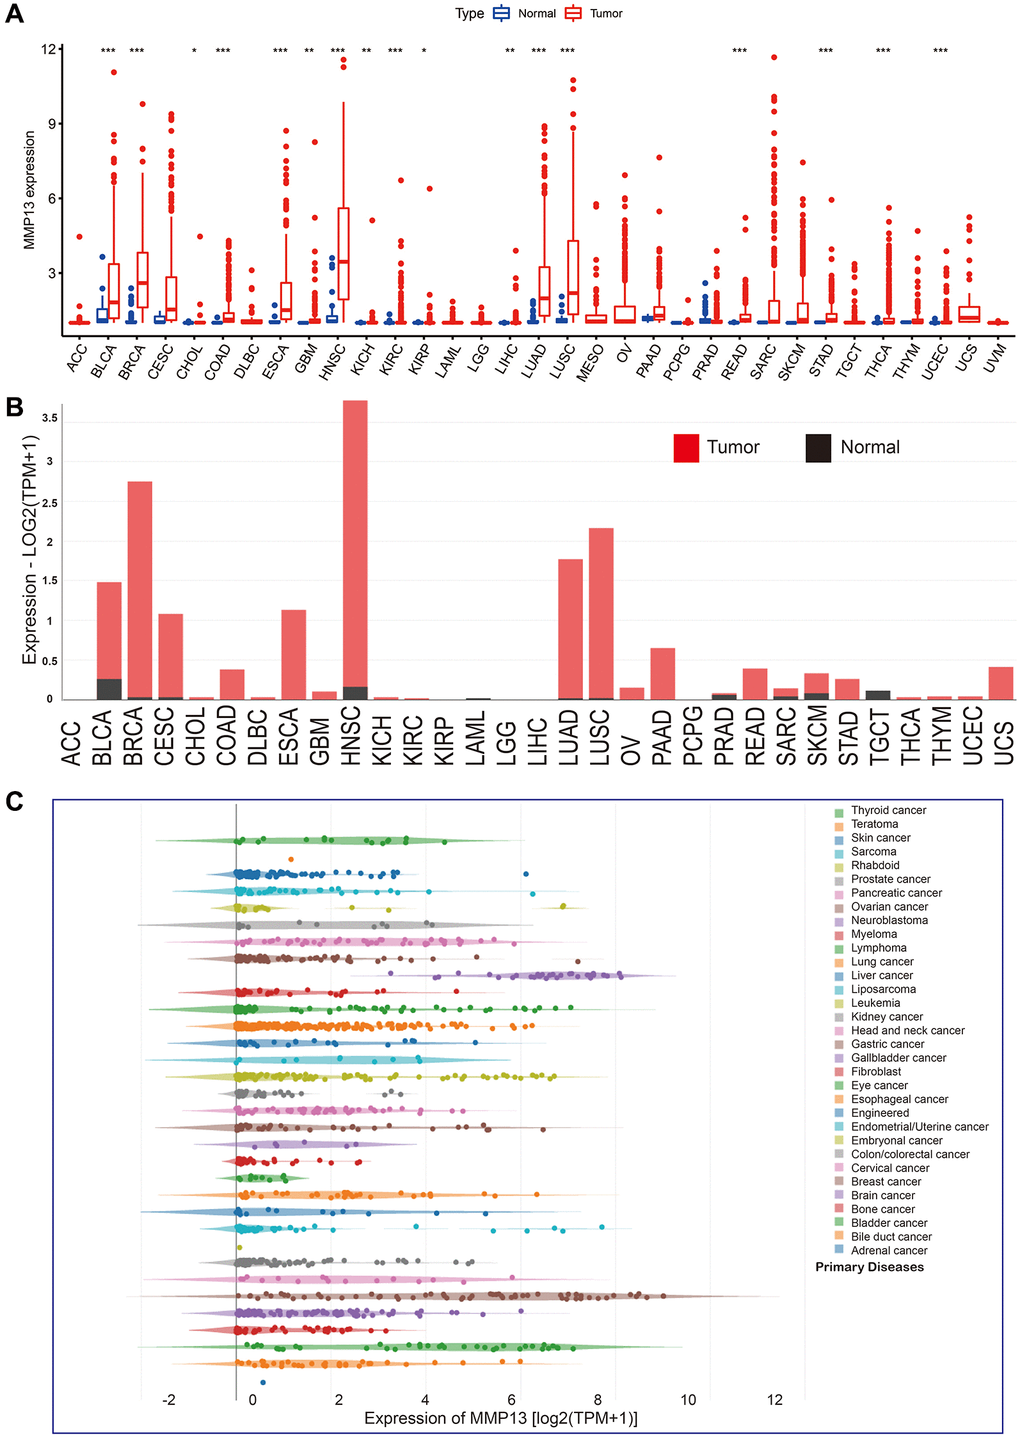
Figure 1.mRNA expression levels of MMP13 in pan-cancer. (A) The levels of MMP13 expression in different types of cancers were analyzed based on the TCGA database. The blue boxplots indicate the normal tissues. The red boxplots indicate the cancer tissues. *P < 0.05, **P < 0.01, ***P < 0.001. (B) Analysis of MMP13 mRNA expression in different cancers by the GEPIA2 web tool. (C) MMP13 mRNA expression in 33 tumor cell lines from the CCLE database.