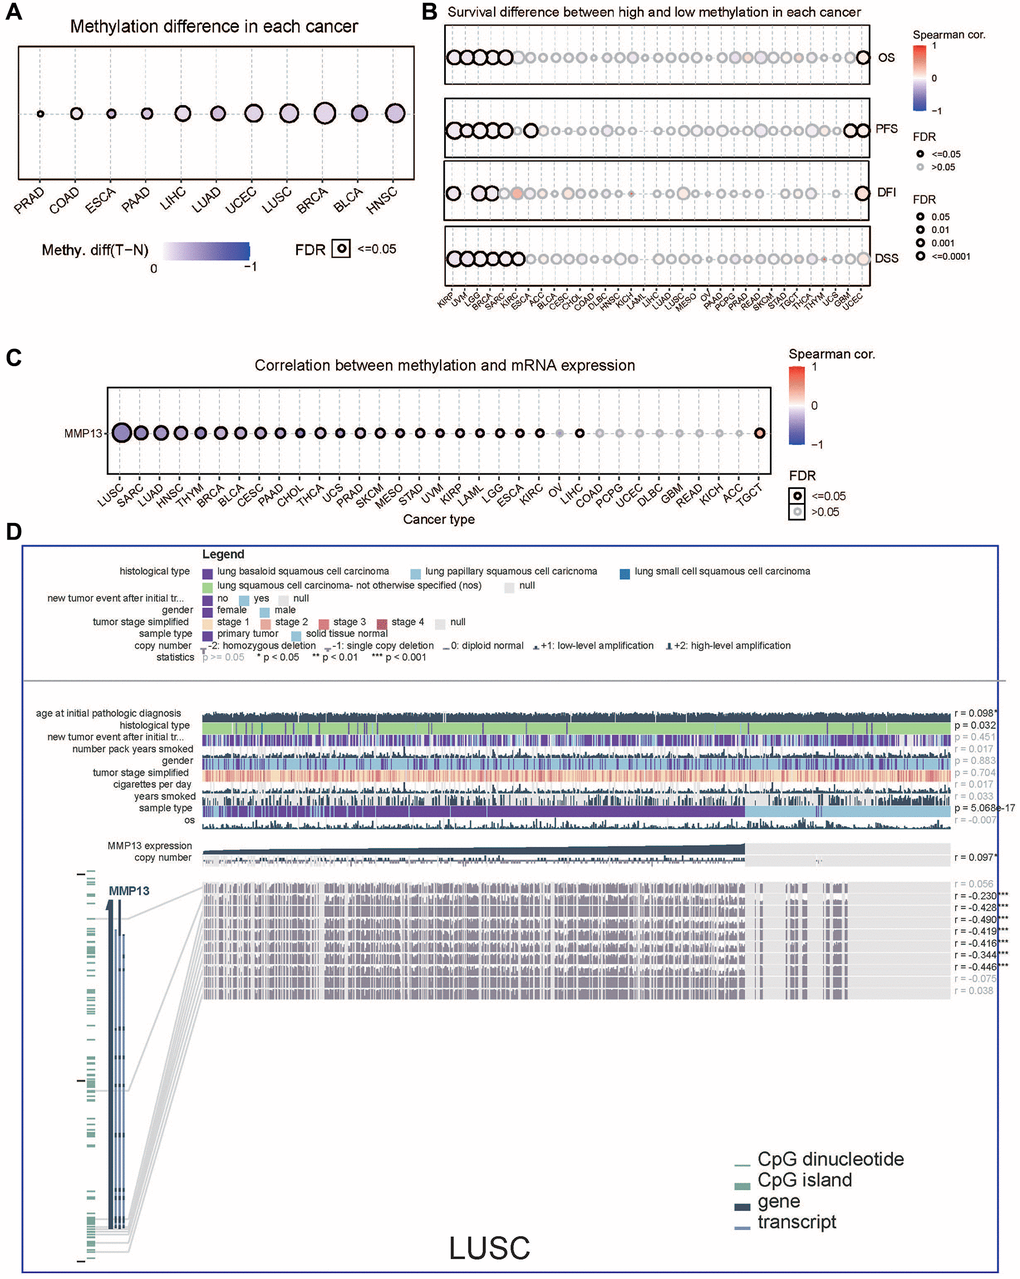
Figure 3.DNA methylation analysis of MMP13 in different tumors. (A) Methylation differences of MMP13 in different cancer tissues compared with normal tissues. Blue dots represent the down-regulation of methylation in tumors, and red dots represent the up-regulation of methylation in tumors; the darker the color, the greater the difference. The size of dots is positively correlated with the FDR significance. (B) Survival difference between MMP13 higher and lower methylation groups in each cancer. Blue dots mean they're negatively correlated, and red dots mean they're positively correlated. (C) Correlation between genome methylation and mRNA expression across different cancers. (D) This chart provides the following key information, including case-relevant clinical data, gene expression, copy number data, survival data, and DNA methylation data, along with Benjamini-Hochberg adjusted P value and Pearson correlation coefficient. (Statistical significance: *p < 0.05, **p < 0.01, ***p < 0.001).