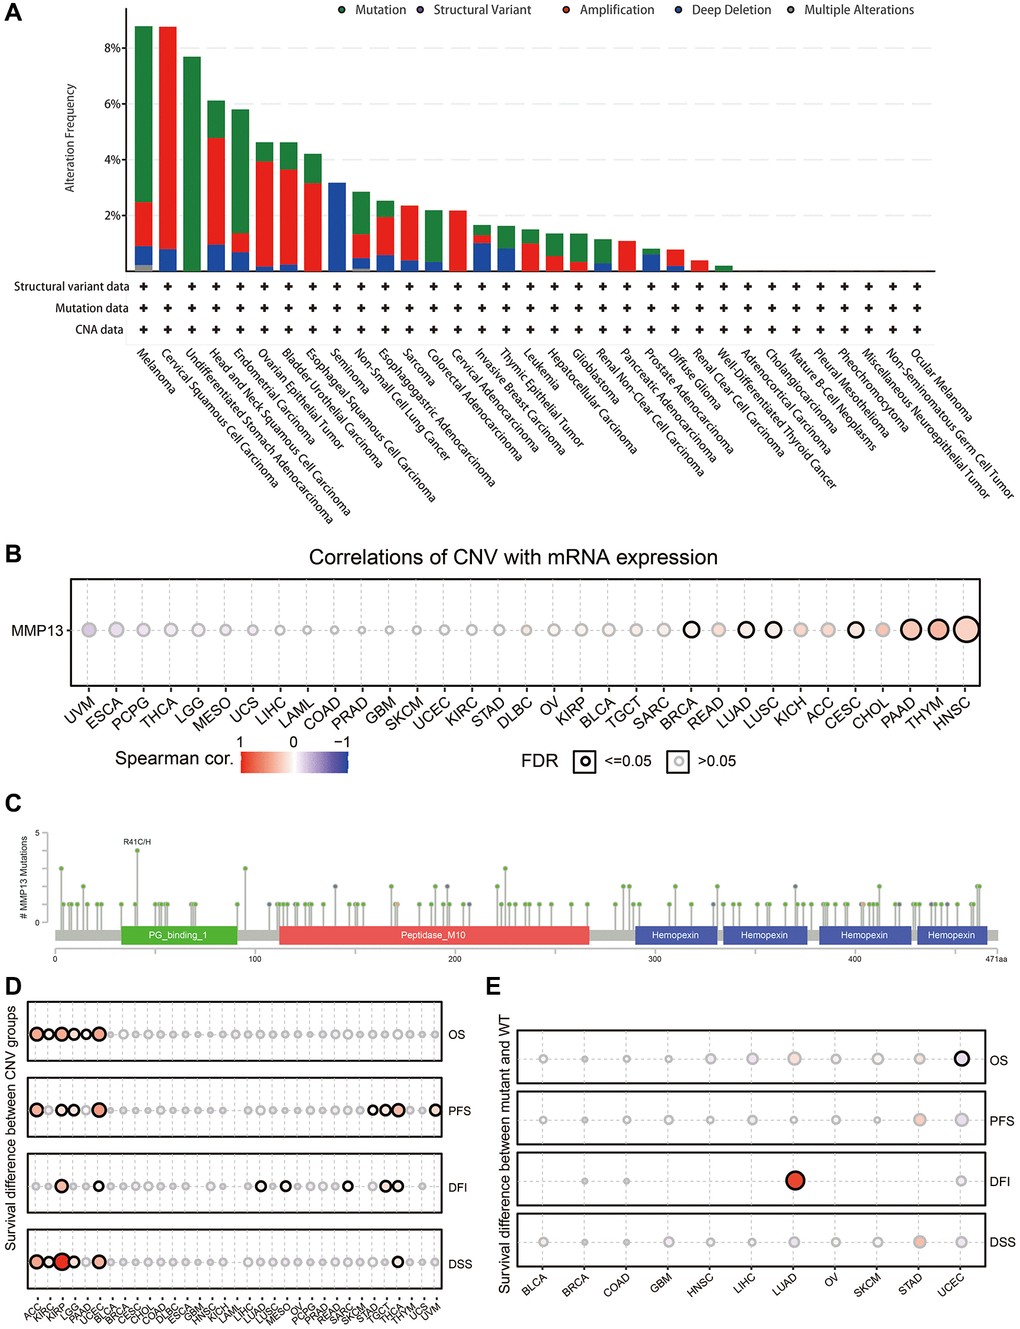
Figure 4.Mutation features of MMP13 in each cancer. (A) The results are displayed as a histogram of the genetic alteration type and frequency of MMP13 in each cancer. CNA, copy-number alterations. (B) Pan-cancer analysis of the correlation between CNV and mRNA expression of MMP13. CNV, copy number variations. CNV is equivalent to CNA in the TCGA database. Blue bubbles represent a negative correlation, and red bubbles represent a positive correlation. Bubble size correlated positively with the FDR significance. The black outline border indicates FDR ≤ 0.05. (C) The mutation diagram of MMP13 in pan-cancer across protein domains from the cBioPortal database. (D) Figure summarizes the survival difference between CNV groups in each cancer. The bubble color from blue to red represents the hazard ratio from low to high. Bubble size is positively correlated with the Cox P value significance. The black outline border indicates Cox P value ≤ 0.05. (E) The survival difference between mutant and wide type groups in pan-cancer. Hazard ratios and Cox p-values displayed by the color and size of bubbles.