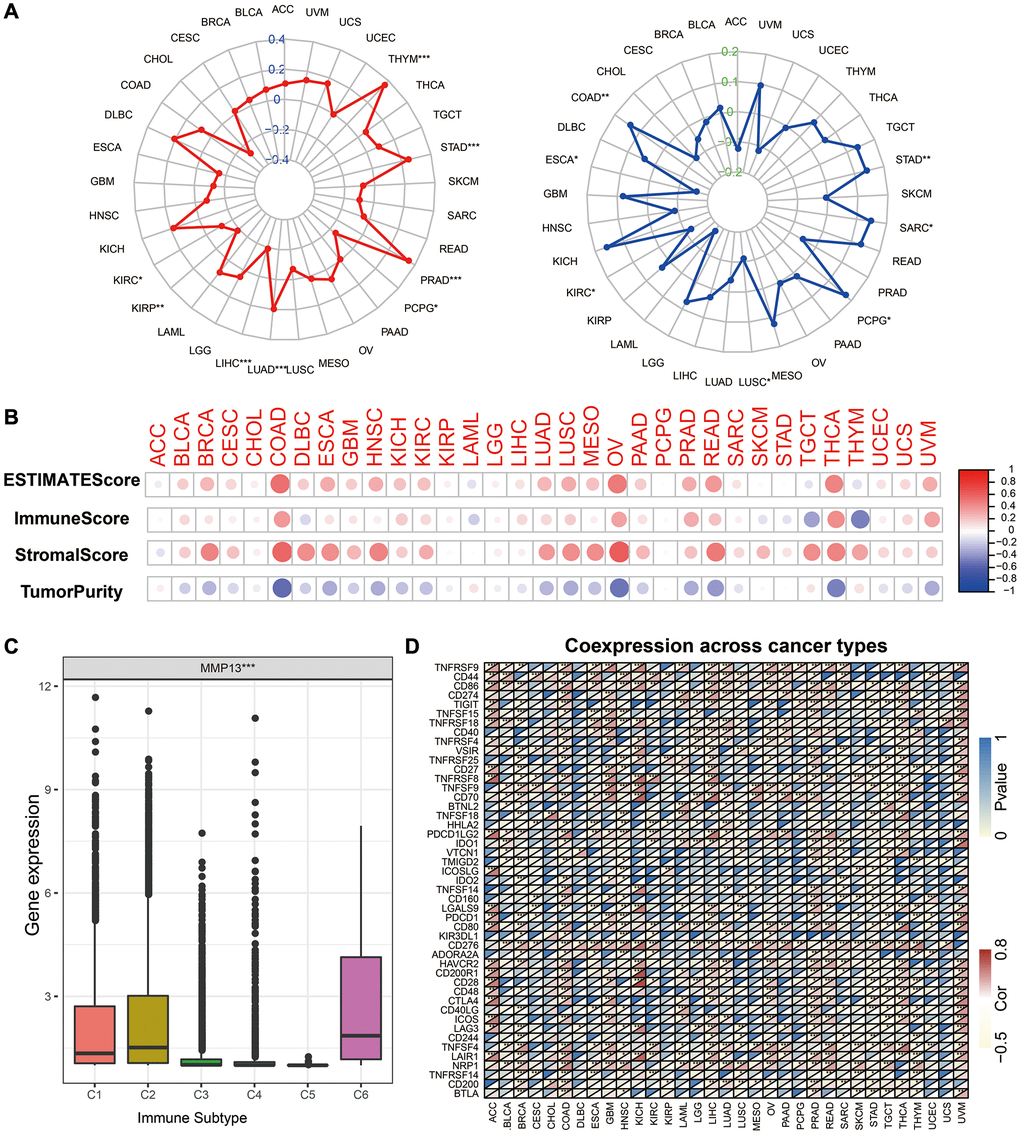
Figure 5.Correlation of MMP13 expression and the TMB, MSI, and tumor immune microenvironment. (A) Radar graphs display the correlation of MMP13 expression with tumor mutation burden (TMB) and microsatellite instability (MSI) in pan-cancer. The red or the blue curves represent the correlation coefficient, *p < 0.05, **p < 0.01, ***p < 0.001. (B) Correlation of MMP13 with the ESTIMATE score, the immune score, the stromal score, and the Tumor purity. (C) The differences of MMP13 expression in six immune subtypes. C1: wound healing, C2: IFN-gamma dominant, C3: inflammatory, C4: lymphocyte depleted, C5: immunologically quiet, C6: TGF-β dominant. (D) Heatmap illustrates the correlation between MMP13 expression and different immune genes in pan-cancer. For each pair, the top left triangle represents the P-value, and the bottom right triangle represents the correlation coefficient *p < 0.05, **p < 0.01, and ***p < 0.001.