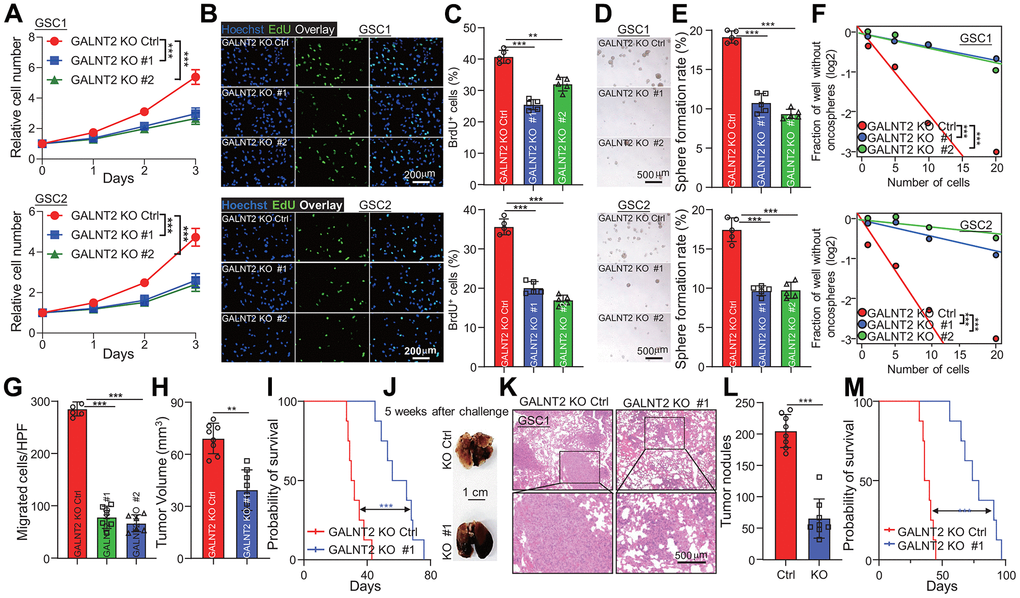
Figure 3.GALNT2 is essential for GSCs malignant behaviors. (A–C) Targeting GALNT2 clearly reduced indicated GSCs cell proliferation rate. As shown by cell proliferation assay (A, B) and EdU staining assay (C). Scale bar: 200 μm. (D) Depletion of GALNT2 markedly suppressed indicated GSC cells tumor oncosphere formation ability. Scale bar: 500 μm. (E) Quantification data for (D). (F) Indicated GSC cells tumor oncospheres formation ability was markedly blocked by depletion of GALNT2 determined by in vitro limiting dilution assay. (G) A total of 1.5 × 10⁵ GSC1 cells with or without depletion of GALNT2 were intracranially injected into NOD/NSG mice. Tumor growth was examined 5 weeks after the challenge, and representative H&E-stained coronal brain sections with tumor xenografts are shown. (H) Tumor volume was calculated. n=8 mice per group. (I) A total of 1.5 × 10⁵ GSC1 cells with or without depletion of GALNT2 were intracranially injected into NOD/NSG mice. Mouse survival time was recorded and presented with Kaplan-Meier survival curves. n=8 mice per group. (J) Images of lung of mice challenged with GSC1 cells expressed with or without GALNT2 knock out plasmid through intravenous injection. Mice were sacrificed at day 36 after intravenous injection of 1.5 × 10⁵ GSC1 cells, and the lung of mice was taken out to count tumor nodules. Scale bar: 1 cm. (K) Representative images of H&E-stained lung sections with tumor xenografts are shown. (L) Quantification of tumor nodules on NOD/NSG mice administrated with GSC1 cells expressed with or without GALNT2 knock-out plasmid. n= 8 per group. (M) Survival of NOD/NSG mice injected with GALNT2 knock-out or control cells after intravenous injection of 1.5 × 10⁵ GSC1 cells. ** and *** indicate p < 0.01 and p < 0.001, respectively.