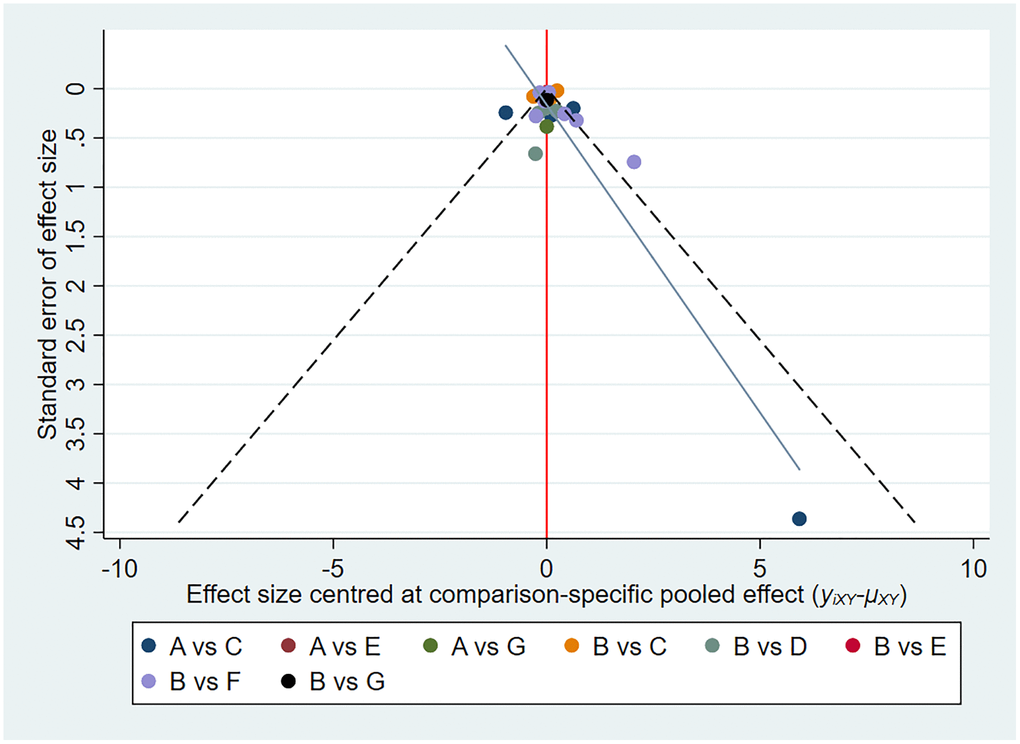
Figure 5.Funnel plots assessing hemoglobin levels. The red line represents the null hypothesis. The yellow/blue line represents the regression line. Different colours correspond to different comparisons. Abbreviations: A: placebo/control; B: ESAs; C: daprodustat; D: molidustat; E: vadadustat; F: roxadustat; G: enarodustat.