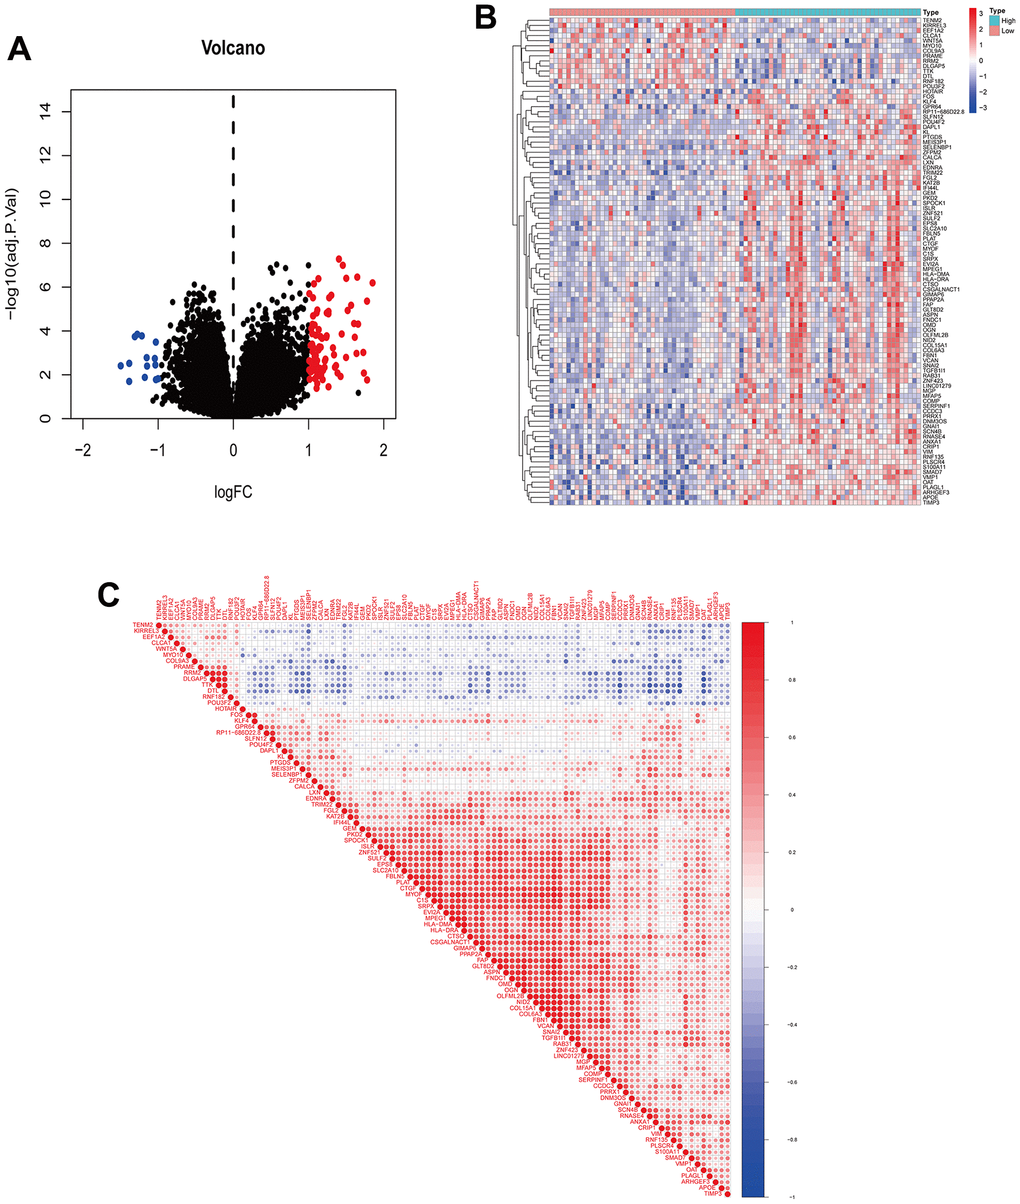
Figure 3.Visualization of DEGs and correlation analysis of ANXA1. (A) Volcano plot of DEGs. Red dots indicate upregulated genes, green dots indicate downregulated genes, and black dots indicate genes with insignificant differences. (B) Heatmap of DEGs. Red indicates high expression, blue indicates low expression, and white indicates moderate expression. (C) Correlation coefficient heatmap of DEGs. Red represents positive correlation and green represents negative correlation.