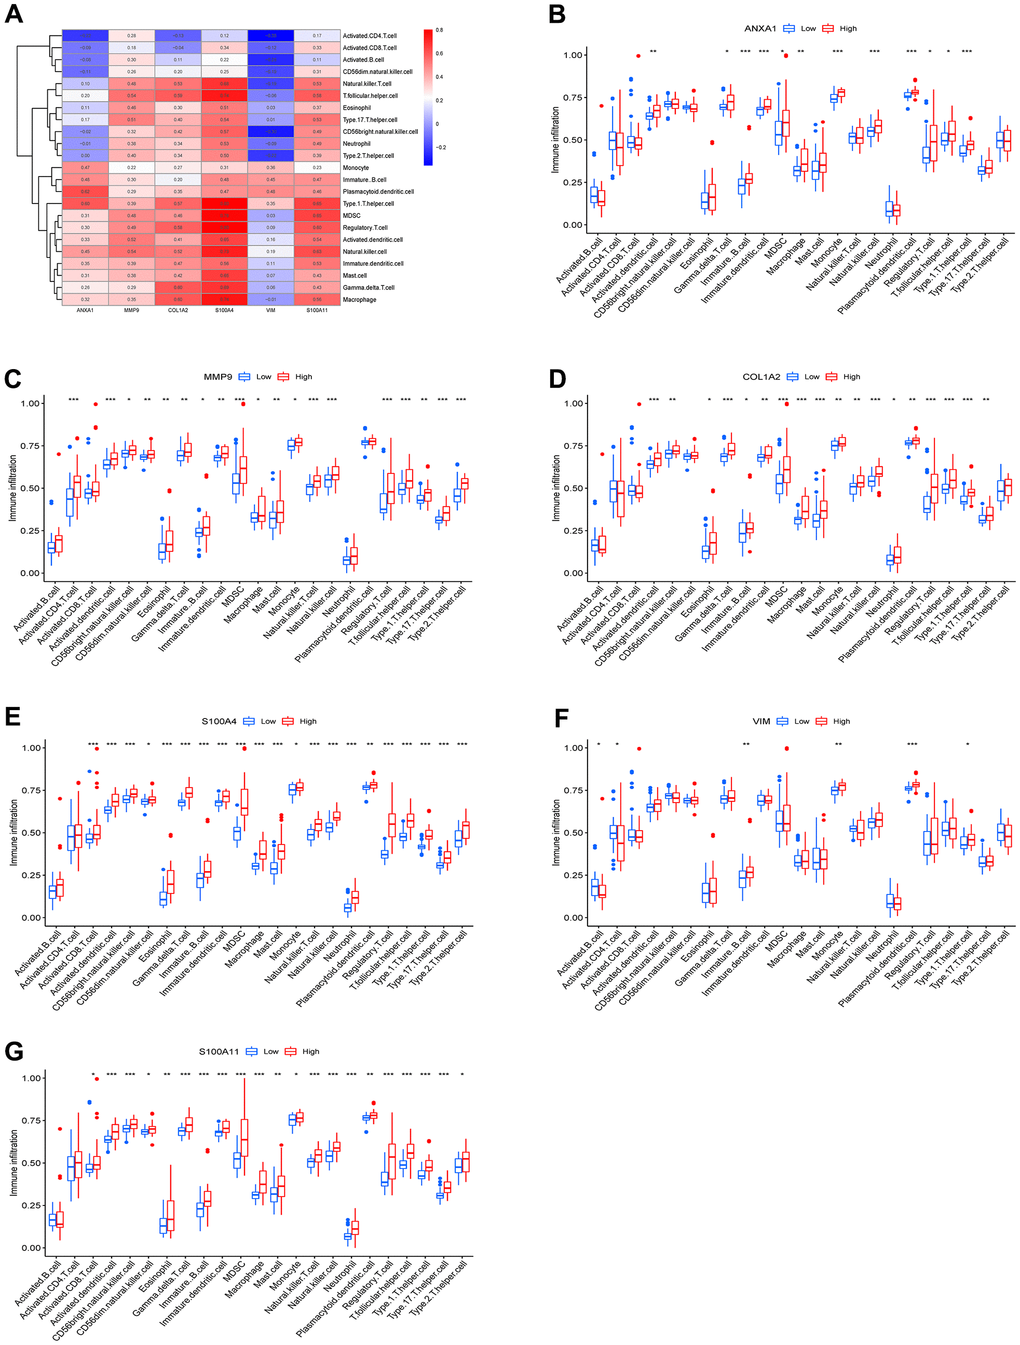
Figure 7.Immune infiltration results of the 6 hub genes. (A) Heatmap of the correlation between immunocyte abundance and 6 hub genes. Box diagram of immunocyte abundance in the ANXA1 (B), MMP9 (C), COL1A2 (D), S100A4 (E), VIM (F) and S100A11 (G) high- and low-expression groups.