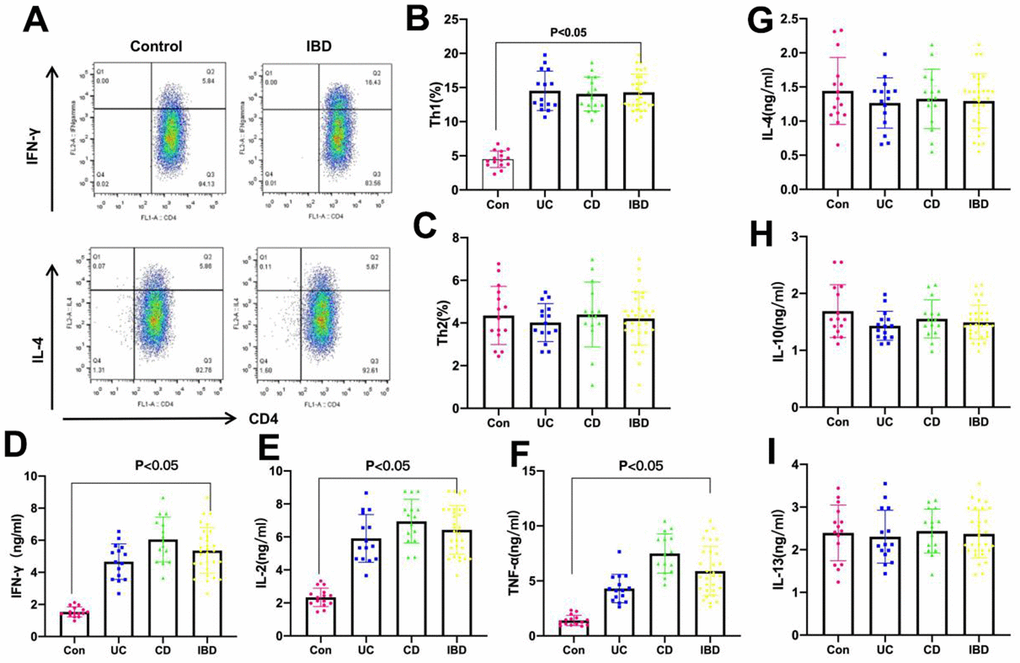
Figure 1.Proportions of Th1 and Th2 cells and expression of cytokines in tissues of IBD patients. (A–C) Proportions of Th1 and Th2 were detected by FCM. As a result, the proportions of Th1 cells in CD and UC groups were significantly higher than that in Control group, and that was significantly different between IBD (UC+CD) and Control groups, while Th2 cell proportion did not exhibit any significant difference. The proportion of Th1 cells in IBD increased. (D–F) The levels of Th1 cell marker factors IFN-γ, IL-2 and TNF-α. The levels of IFN-γ, IL-2 and TNF-α in IBD (UC+CD) were evidently higher than those in Control group, and those in CD patients were higher than those in UC patients, with significant difference. (G–I) The levels of Th2 cell marker factors IL-4, IL-10 and IL-13. The levels of IL-4, IL-10 and IL-13 in IBD (UC+CD) group were not significantly different compared with those in Control group.