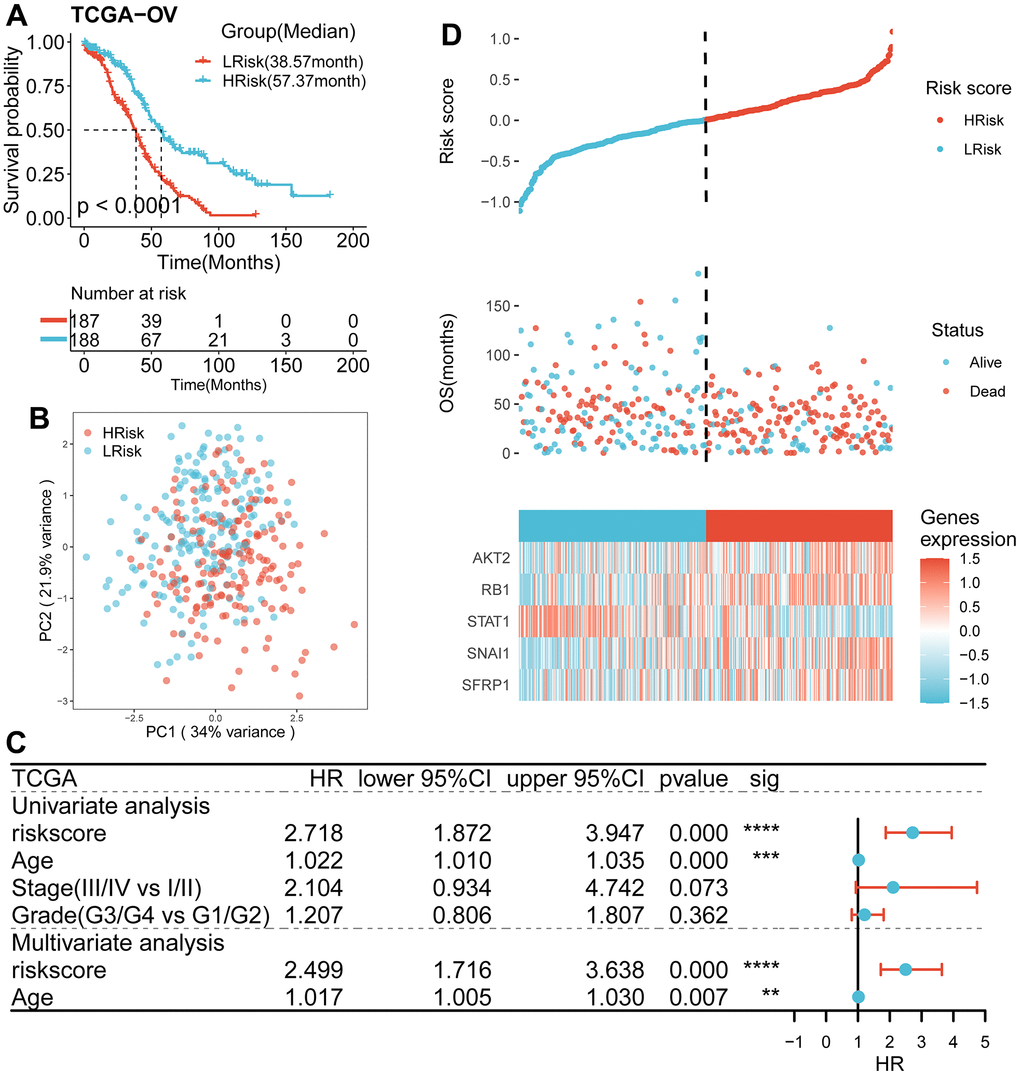
Figure 3.Survival analysis and prognostic values of the 5-gene signature model in the TCGA discovery cohort. (A) Kaplan-Meier curves for the OS of patients between the HRisk and LRisk group (Log-rank test, p<0.001). (B) PCA plot of patients in different groups. (C) Results of the univariate and multivariate Cox regression analyses regarding OS in the TCGA cohort. (D) The distribution of the risk scores. The distributions of OS status, OS and risk score in the TCGA cohort. Heatmap plot for mRNA expression of 5 genes between the HRisk and LRisk group. Expression values were z-score transformed.