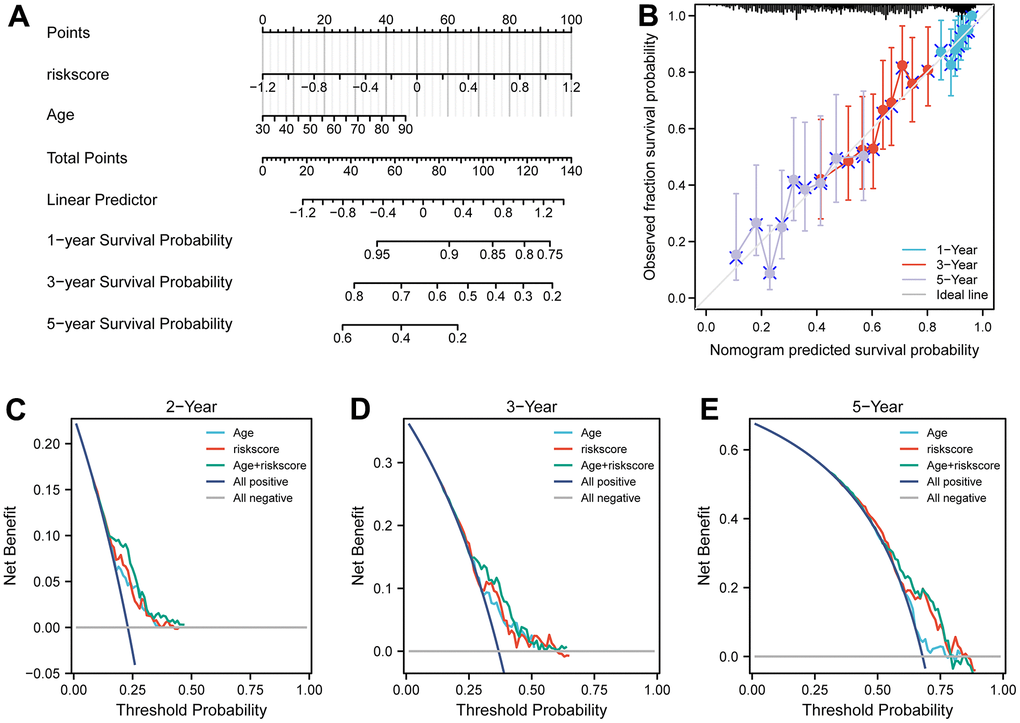
Figure 5.Nomograms for predicting the probability of patient mortality based on risk score and clinical variables in TCGA cohort. (A) Nomograms plots of TCGA cohort. (B) Plots depict calibration of nomograms based on riskscore in terms of agreement between predicted and observed 1-year, 3-year, and 5-year outcomes in TCGA cohorts. Nomogram performance is shown by the plot, relative to the 45-degree line, which represents the ideal prediction. (C–E) Decision curve analyses of the nomograms based on OS in TCGA cohort for 1-year, 3-year, and 5-year risk.