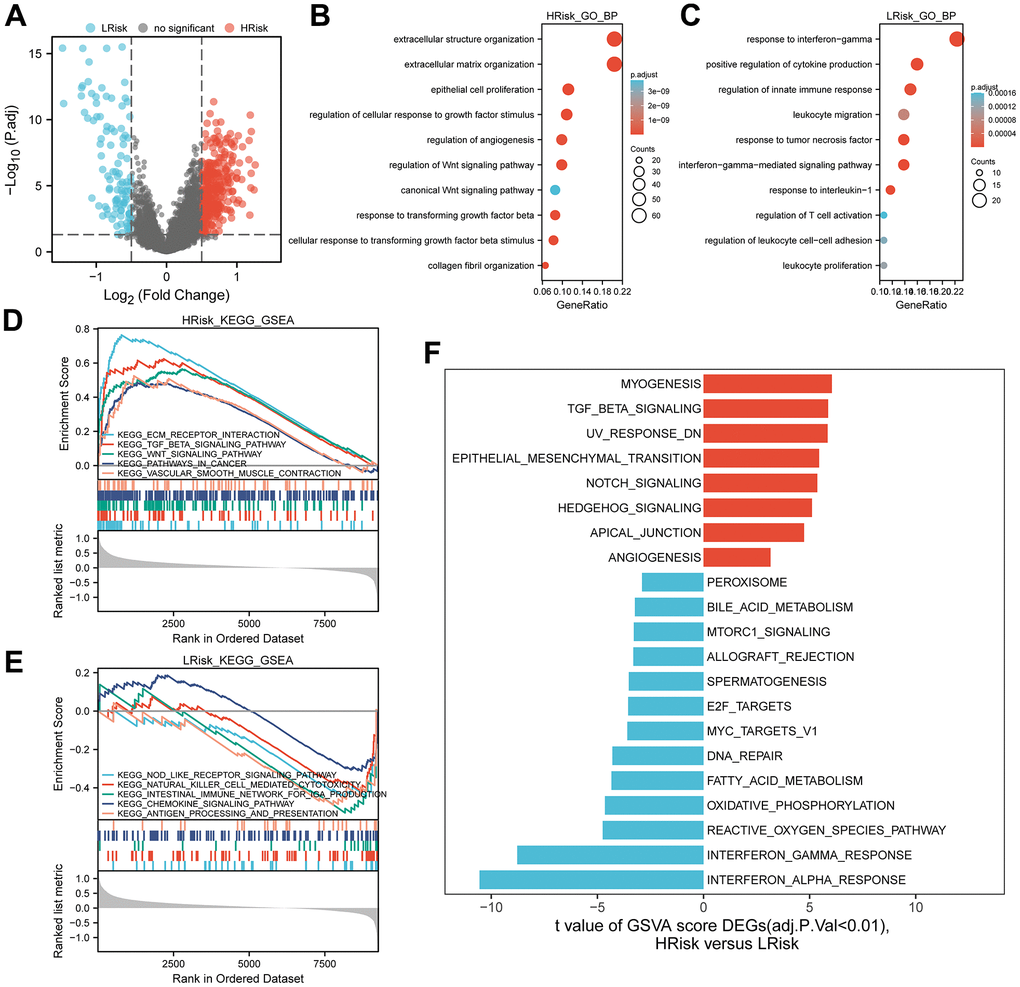
Figure 6.Representative results of pathway analysis. (A) Volcano plot displayed DEGs between the HRrisk and LRisk subgroups (FDR<0.05, |log2 fold-change|>0.5). (B, C) Gene Ontology (GO) enrichment analysis of 322 genes up-regulated in the HRisk group (B) and 101 genes up-regulated in the LRisk group (C). (D, E) GSEA analysis of KEGG gene sets in the HRisk (D) and LRisk (E) subgroups (FDR<0.25). (F) GSVA analysis of hallmark pathways in the TCGA cohort was performed. Differential analysis of GSVA score between HRisk and LRisk group were displayed and FDR<0.01 were controlled.