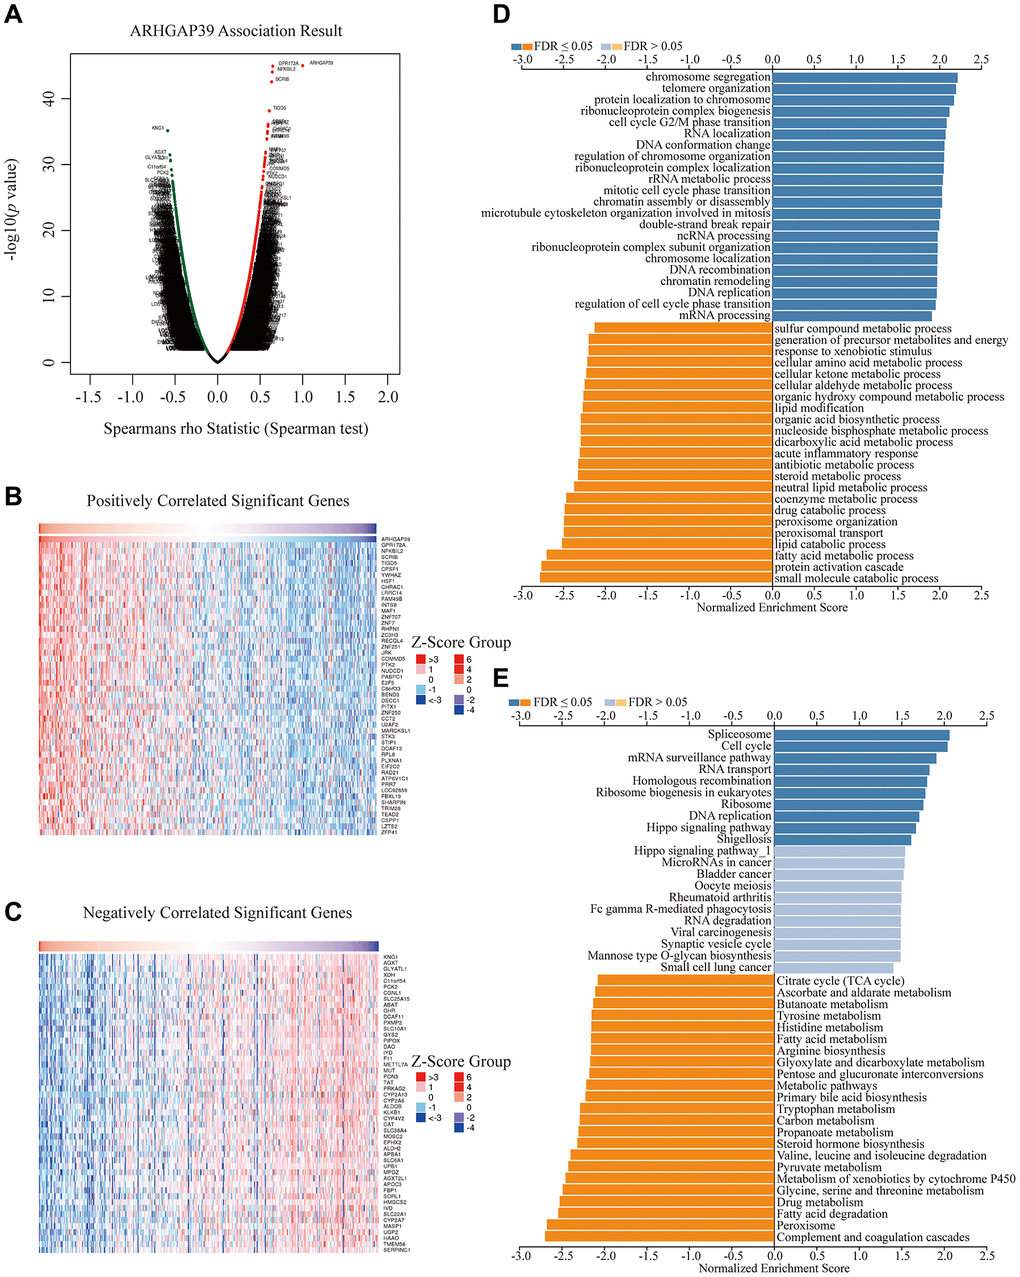
Figure 3.Enrichment analysis of ARHGAP39 functional networks in HCC. (A) A correlation analysis with spearman's rho value (p value 0.05) was used to assess correlations between ARHGAP39 and genes differentially expressed in HCC. (B, C) Heat maps show genes positively and negatively correlated with ARHGAP39 in HCC (Top 50). (D) GO pathway analysis. Dark blue and orange indicate FDR ≤ 0.05, light blue and orange indicate FDR > 0.05 in A. FDR, false discovery rate. (E) KEGG pathway analysis. Dark blue and orange indicate FDR ≤ 0.05, light blue and orange indicate FDR > 0.05 in. FDR q-val: false discovery rate.