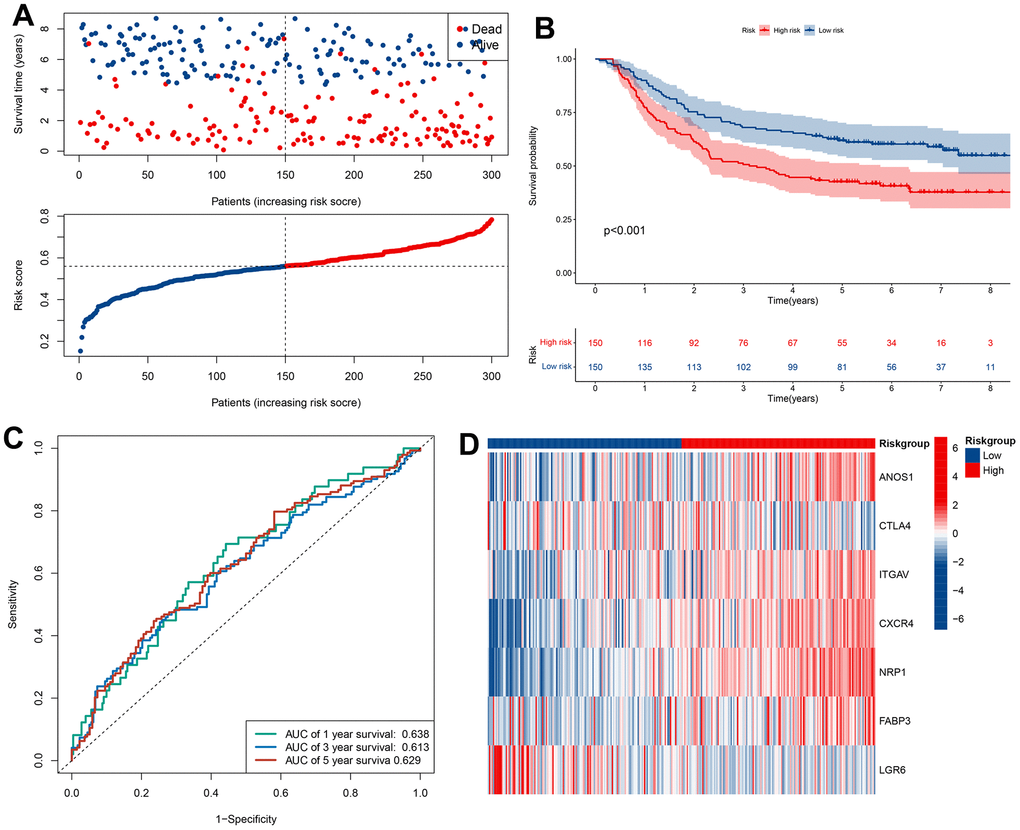
Figure 5.Validation of prognostic models based on CRIGs in GSE62254 dataset. (A) The survival status and survival time of GC patients ranked by risk score in GSE62254 dataset. (B) Kaplan-Meier analysis between high-risk groups and low-risk groups in GSE62254 dataset. (C) Time-dependent ROC curve of risk score predicting the overall survival (OS) in GSE62254 dataset. (D) Heatmap showed the differences of 7 CRIGs between high risk and low risk patients in GSE62254 dataset.