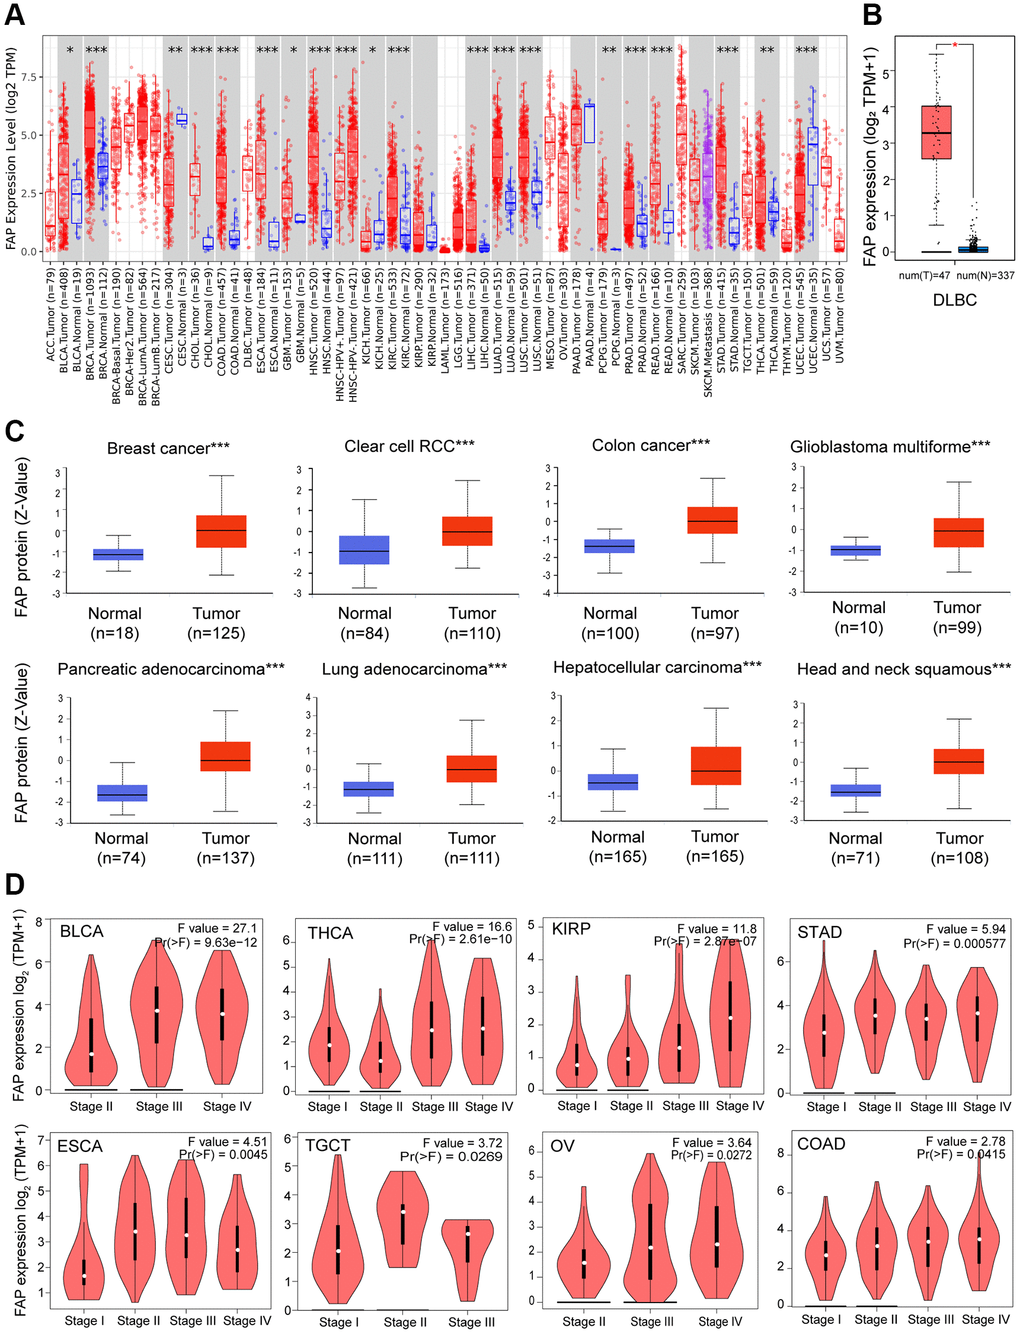
Figure 1.FAP expression profile in human cancers. (A) Human FAP expression levels in different cancer types from the TCGA database. The statistical significance was computed by the Wilcoxon test. (B) For DLBC in the TCGA, normal tissues from the GTEx dataset were included as controls. (C) FAP protein expression levels in various cancers compared with normal controls. (D) FAP gene expression was studied according to pathological stages. *P < 0.05, **P < 0.01, ***P < 0.001.