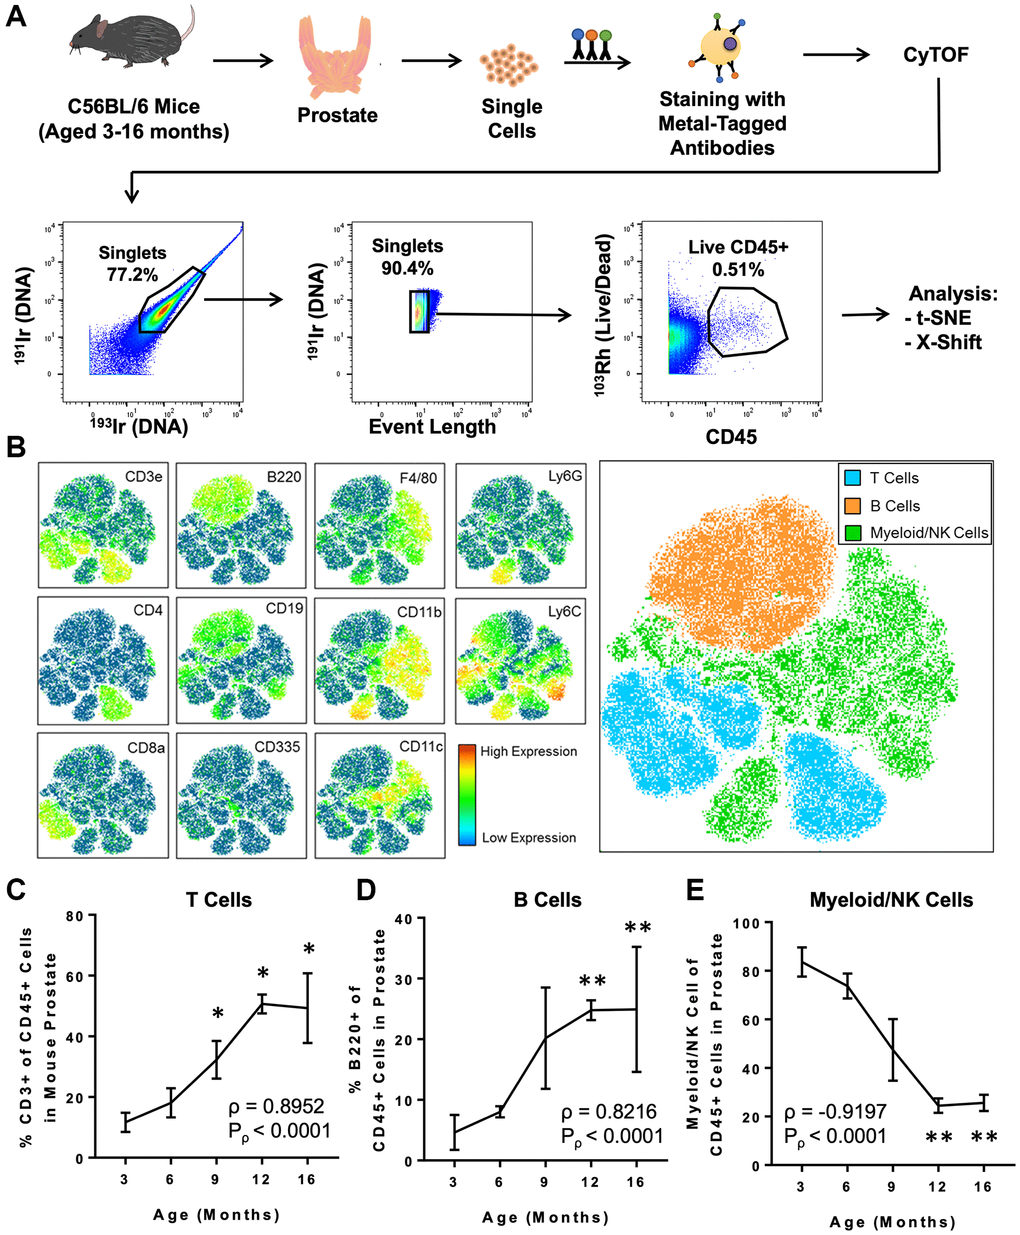
Figure 1.CyTOF immunophenotyping of the aging mouse prostate. (A) Workflow for prostate immunophenotyping using CyTOF. Mouse prostates of different ages were isolated, dissociated to single cells, and stained with a panel of metal-tagged antibodies before data acquisition via mass cytometry. Bivariate plots show gating for single, live CD45+ immune cells before analysis using clustering algorithms (t-SNE and X-Shift). Percentages represent the fraction of events that are within the gate in each bivariate plot. 191Ir/193Ir labels DNA of all cells to distinguish singlets from doublets. 103Rh labels DNA of dead cells. This flowchart was adapted from a previous publication from our group [12]. (B) t-SNE plot generated from the immune cells from mouse prostate, bladder, and kidney. Left: Heat maps showing expression of selected lineage markers by immune cells clustered using t-SNE. See Supplementary Figure 2A for the full set of markers. Right: t-SNE plot separated into 3 broad groups of immune cells (T cells, B cells, and myeloid/NK cells). (C–E) Quantification of changes to the mouse prostate immune cell composition during adult aging for CD3+ T cells (C), B220+ B cells (D), and myeloid/NK cells (E). Spearman correlation coefficient (ρ) and associated p-value (Pρ) represent the correlation between % immune cell type and age. Data represents mean ± SD of 4 biological replicates at each age. Kruskal-Wallis, p < 0.01 (T cells, B cells, and Myeloid/NK cells). Dunn’s multiple comparisons test against 3-months-old, *p < 0.05, **p < 0.01.
Figure 1 — Highly multiplexed immune profiling throughout adulthood reveals kinetics of lymphocyte infiltration in the aging mouse prostate | Aging