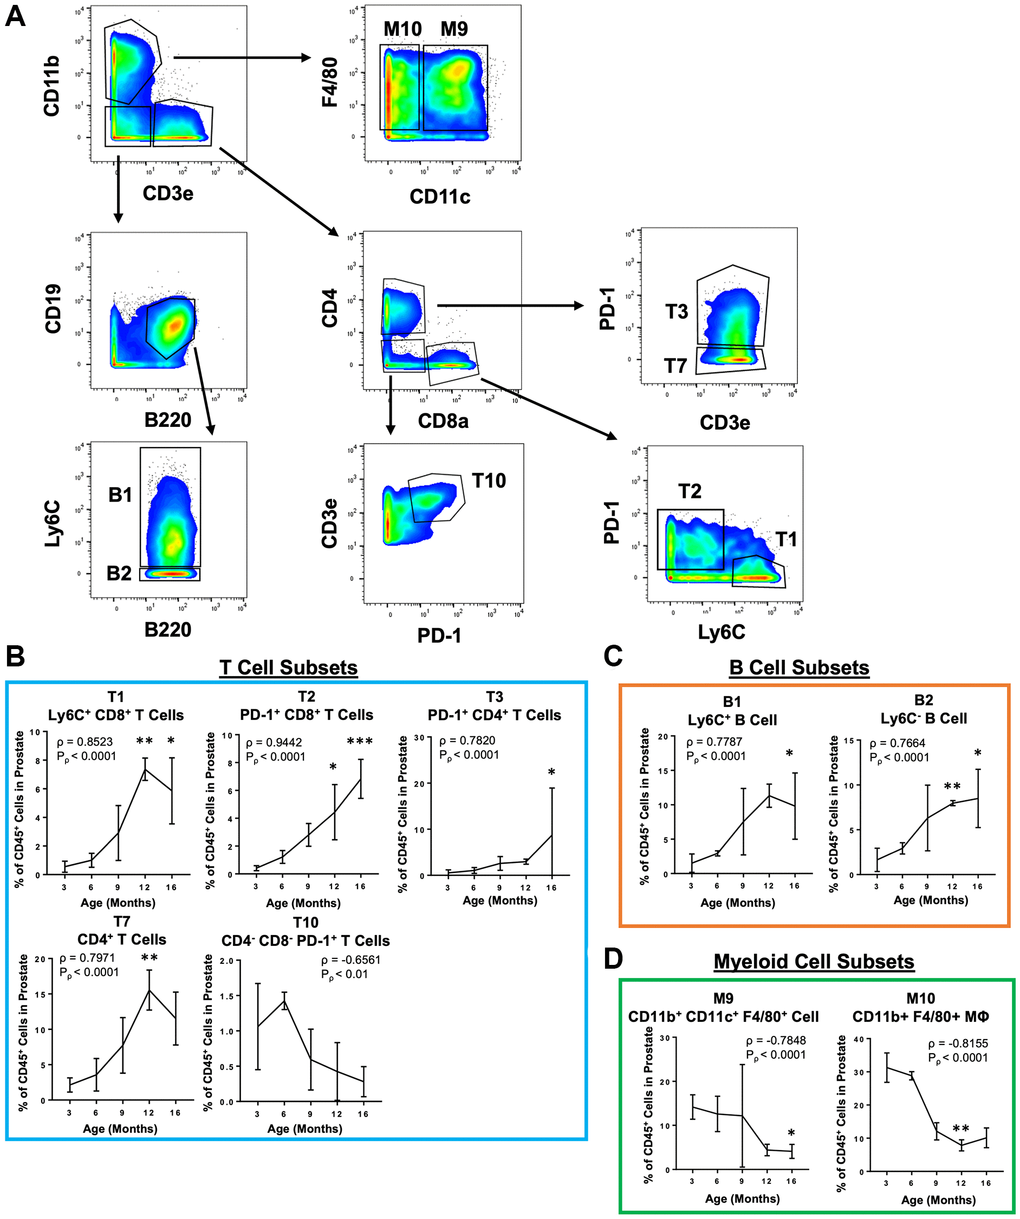
Figure 4.Simplified gating scheme to identify immune cell clusters that change in abundance with age in the mouse prostate. (A) Bivariate plots showing a gating scheme using a simplified 11 marker panel (CD45, CD3e, CD4, CD8a, CD19, B220, F4/80, CD11b, CD11c, Ly6C and PD-1) to identify 4 validated immune cell clusters (T1, T3, B1, and M10) and 5 others (T2, T7, T10, B2, and M9) in the validation CyTOF experiment. (B–D) Quantification of immune cell subset abundance by proportion of total CD45+ cells in the mouse prostate identified using the simplified 11 marker panel separated into T cells (B), B cells (C), and myeloid cells (D). Data represents mean ± SD of 4 biological replicates at each age. MΦ, macrophage. Spearman correlation coefficient (ρ) and associated p-value (Pρ) represent the correlation with age. Kruskal-Wallis, p < 0.05 (T3, T10, B1, B2, M9), p < 0.01 (T1, T2, T7, M10). Dunn’s multiple comparisons test against 3-months-old, *p < 0.05, **p < 0.01, ***p < 0.001.