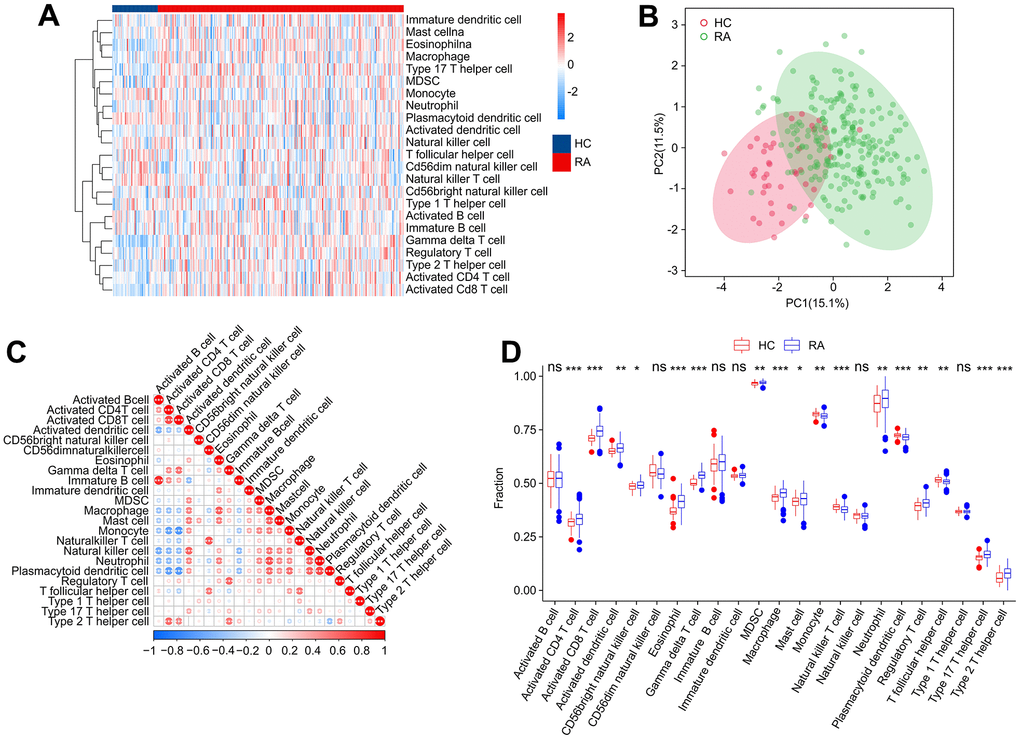
Figure 10.Immune infiltration analysis. (A) Heatmap shows the fraction of 23 types of immune cells in HC and RA groups based on the ssGSEA algorithm. (B) Principal component analysis (PCA) reveals a significant difference based on the 23 immune cells. (C) Correlation analysis of 23 immune cells. (D) The quantitative results of 23-type immune cells. Statistical significance: *P < 0.05; **P < 0.01; ***P < 0.001. ns: no significance.