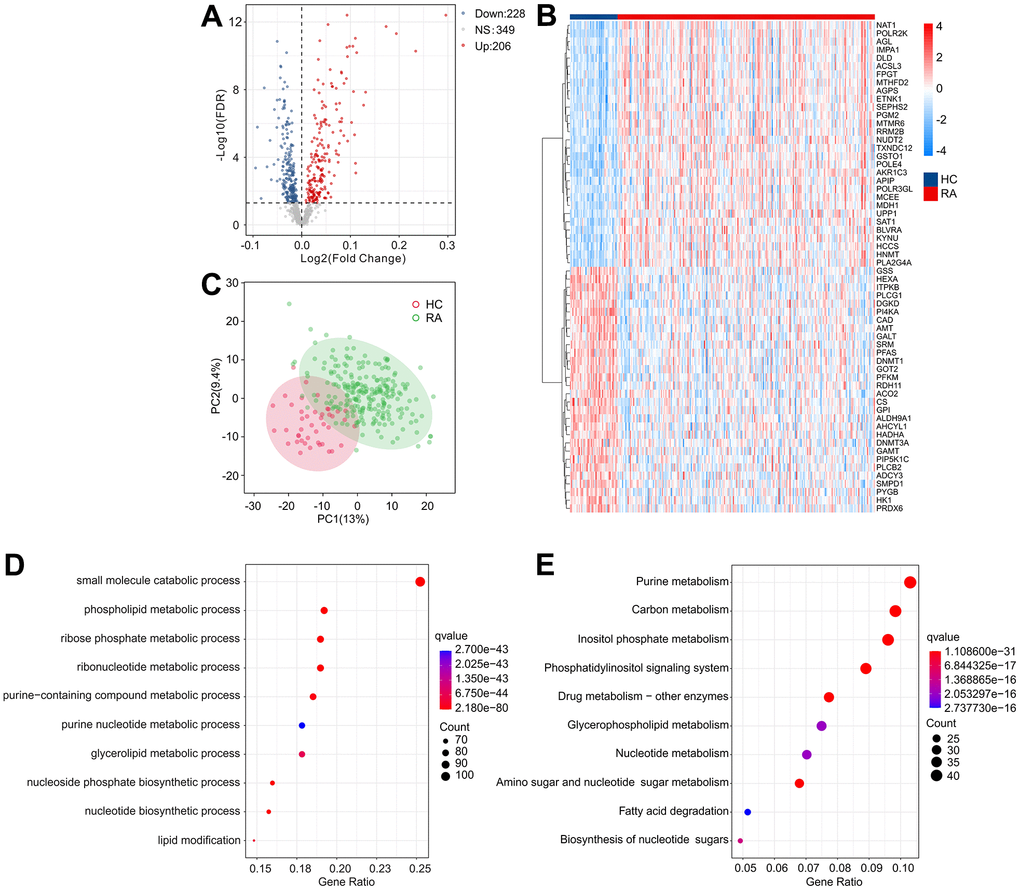
Figure 2.Identification of DE-MRGs and functional enrichment analyses. (A) Volcano diagram shows the DE-MRGs with the threshold setting at |Fold change| ≥ 1 and FDR < 0.05. Red dots represent upregulated differential genes, gray dots represent no significant difference, and blue dots represent down-regulated genes. (B) The expression of top 30 upregulated and down-regulated differential genes in HC and RA groups. (C) Principal component analysis shows a significant separation between HC and RA groups based on the MRGs. The top 10 enrichment results of (D) Gene Ontology (GO) and (E) Kyoto Encyclopedia of Genes and Genomes (KEGG) signaling pathway based on DE-MRGs.