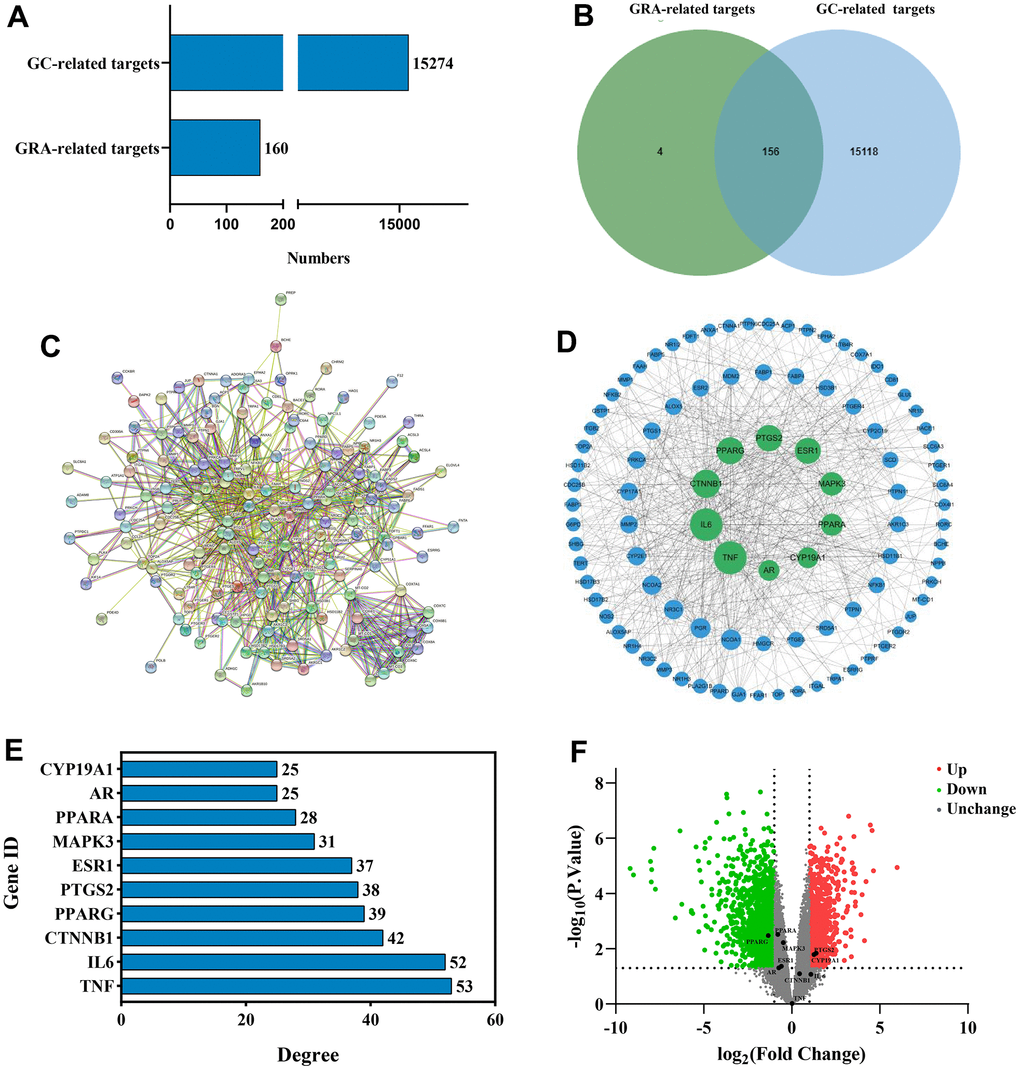
Figure 3.Identification of common targets and analysis of PPI network. (A) Potential targets of GRA-related and GC-related. (B) Venn diagram was applied to obtain the common targets between the GC targets and GRA targets. (C) PPI network of 156 common targets constructed with STRING. (D) The hub targets of PPI network. Larger node sizes indicate higher degree, green indicates higher degree, and blue indicates lower degree. (E) The PPI network’s 10 hub targets ranked by degree ≥ 25. (F) Volcano plot of differentially expressed genes in GC. Red represents upregulated genes and green represents downregulated genes.