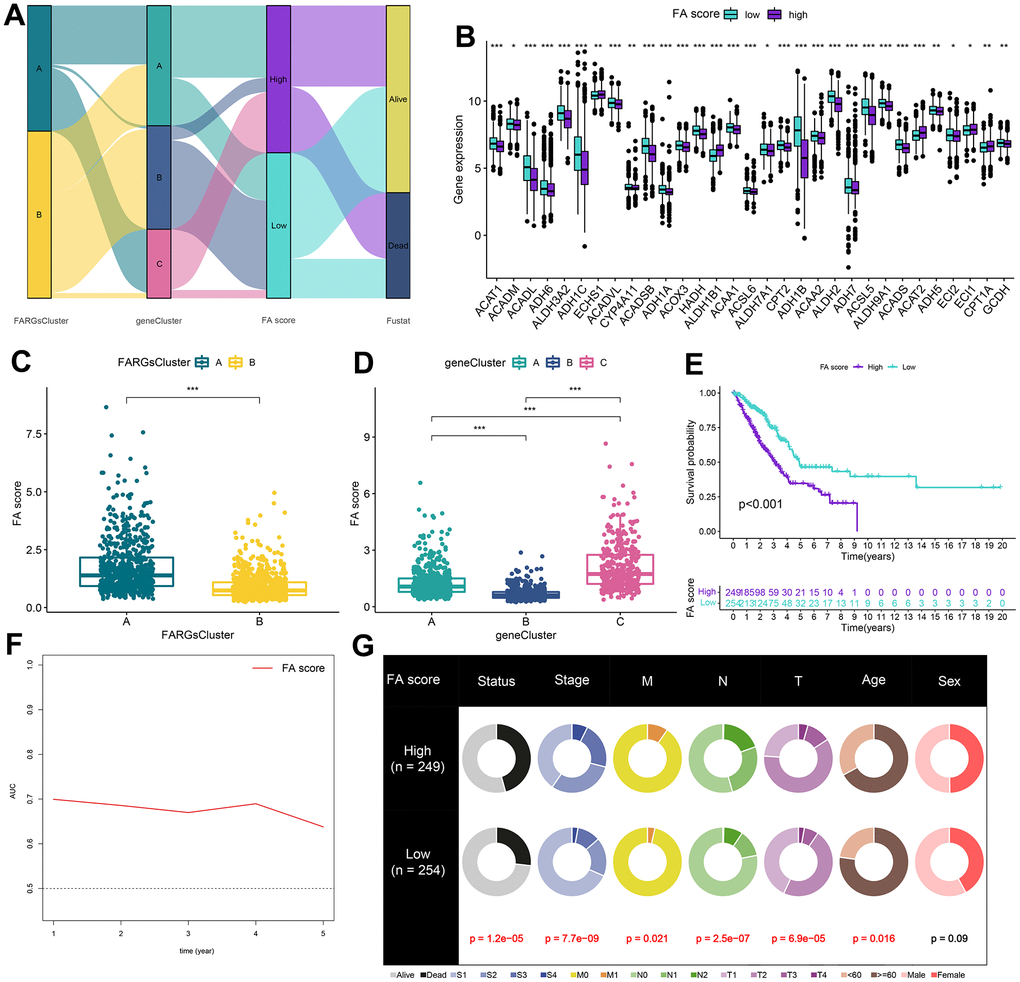
Figure 5.Construction of FA score. (A) Alluvial diagram of clusters distributions in groups with different FA score and survival outcomes. (B) Expression of FARGs between high and low FA score groups. (C) Differences in FA score between FARGs clusters. (D) Differences in FA score between gene clusters. (E) Kaplan–Meier curves for patients with high and low FA score in the TCGA-LUAD cohort. (F) Time-dependent receiver operating characteristic curve of FA score for predicting the prognosis of the LUAD patients in the TCGA-LUAD. (G) The circular pie chart for the proportion difference of clinical indices. ns, not significant, *P < 0.05, **P < 0.01, ***P < 0.001, ****P < 0.0001.