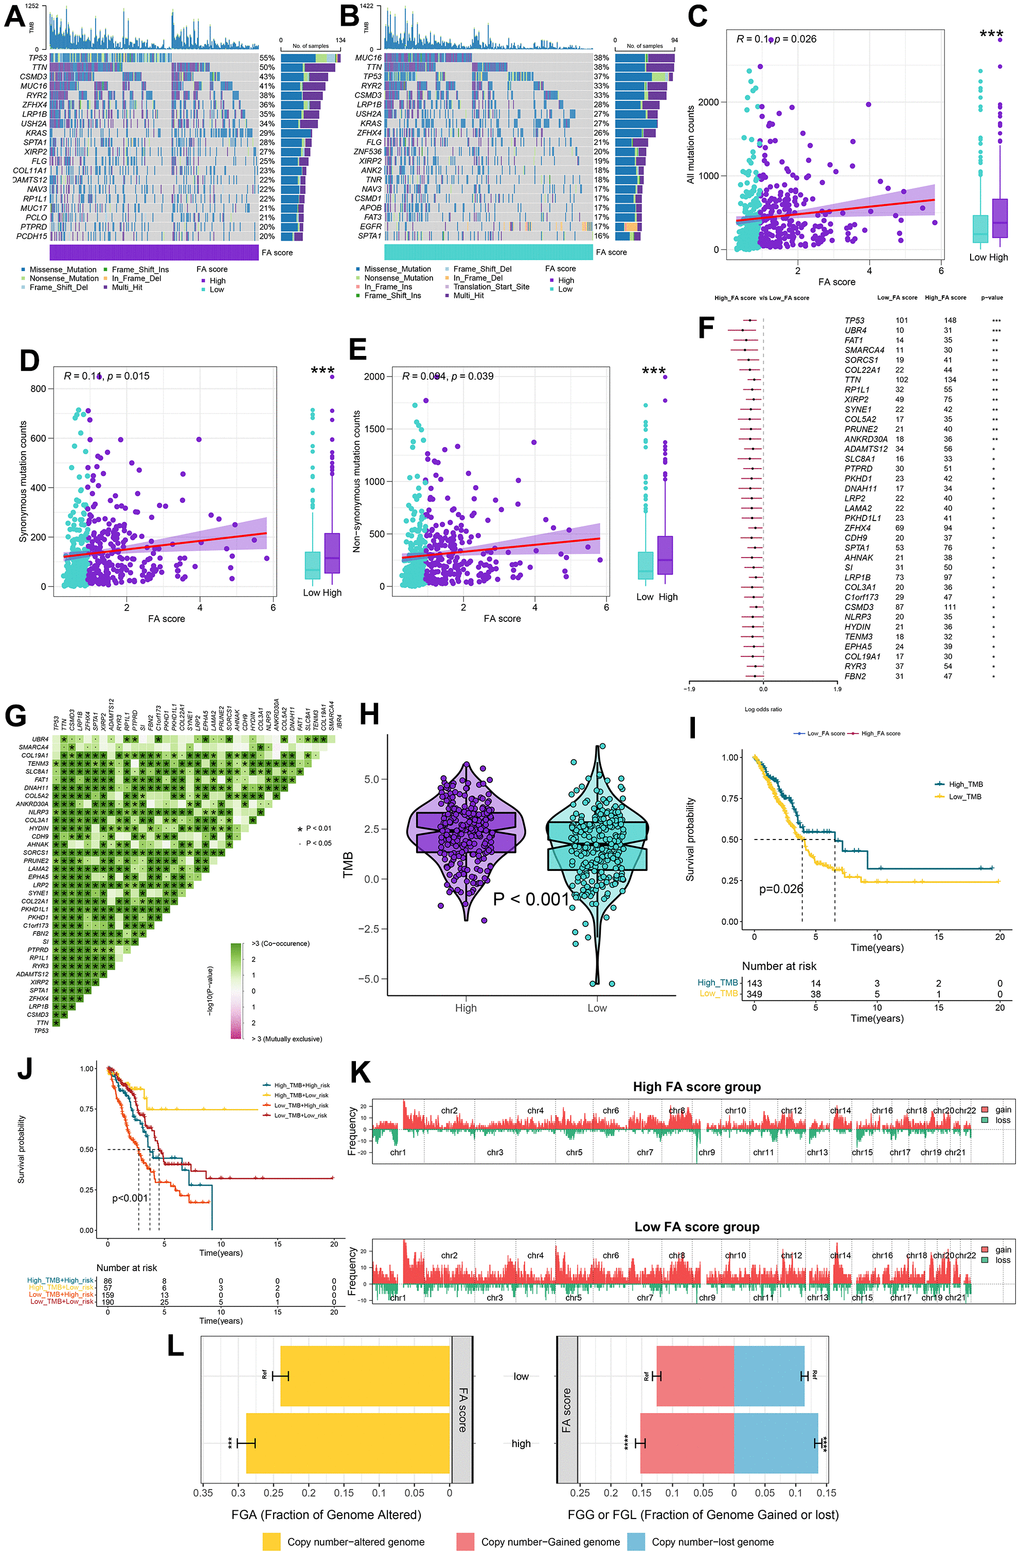
Figure 7.Integrated comparisons of somatic mutation and CNVs between FA score groups in the TCGA cohort. (A, B) Waterfall plots showing the mutation information of the top 20 genes with the highest mutation frequency in high and low FA score groups. (C–E) Association between all mutation counts, synonymous mutation counts, nonsynonymous mutation counts, and FA score and their distribution in the low and high FA score groups. (F) Differentially mutated genes between high and low FA score groups are displayed as a forest plot. (G) Interaction effect of genes mutating differentially in patients in the low and the high FA score groups. (H) Distribution of TMB in the low and the high FA score groups. (I) Kaplan–Meier curves for the OS of the high-TMB and low-TMB groups. (J) Kaplan–Meier curves for patients stratified by both TMB and FA score. (K) Gene fragments profiles with amplification (red) and deletion (green) among the two groups. (L) Comparison of the fraction of the genome altered, lost, and gained between the two groups. ns, not significant, *P < 0.05, **P < 0.01, ***P < 0.001, ****P < 0.0001.