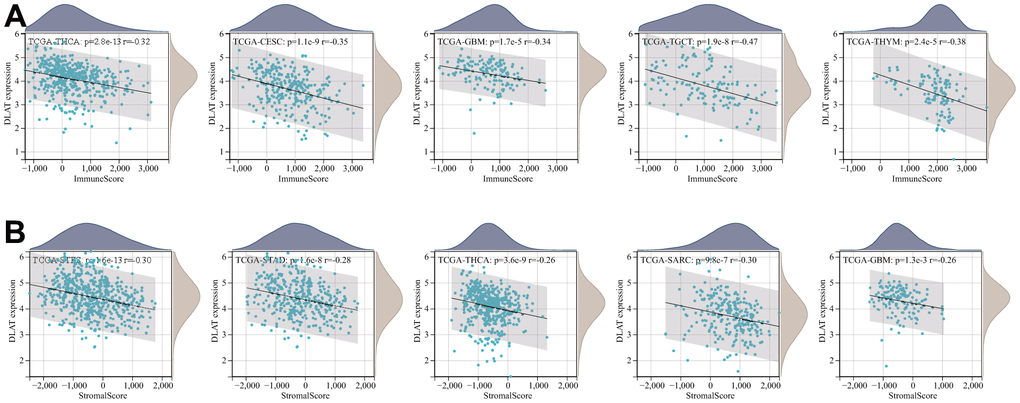
Figure 9.Five tumors with the highest correlation coefficients between DLAT expression and the tumor microenvironment. (A) Correlation between DLAT and immune scores in THCA, CESC, GBM, TGCT, and THYM. (B) Correlation between DLAT and stromal scores in STES, STAD, THCA, SARC, and GBM.