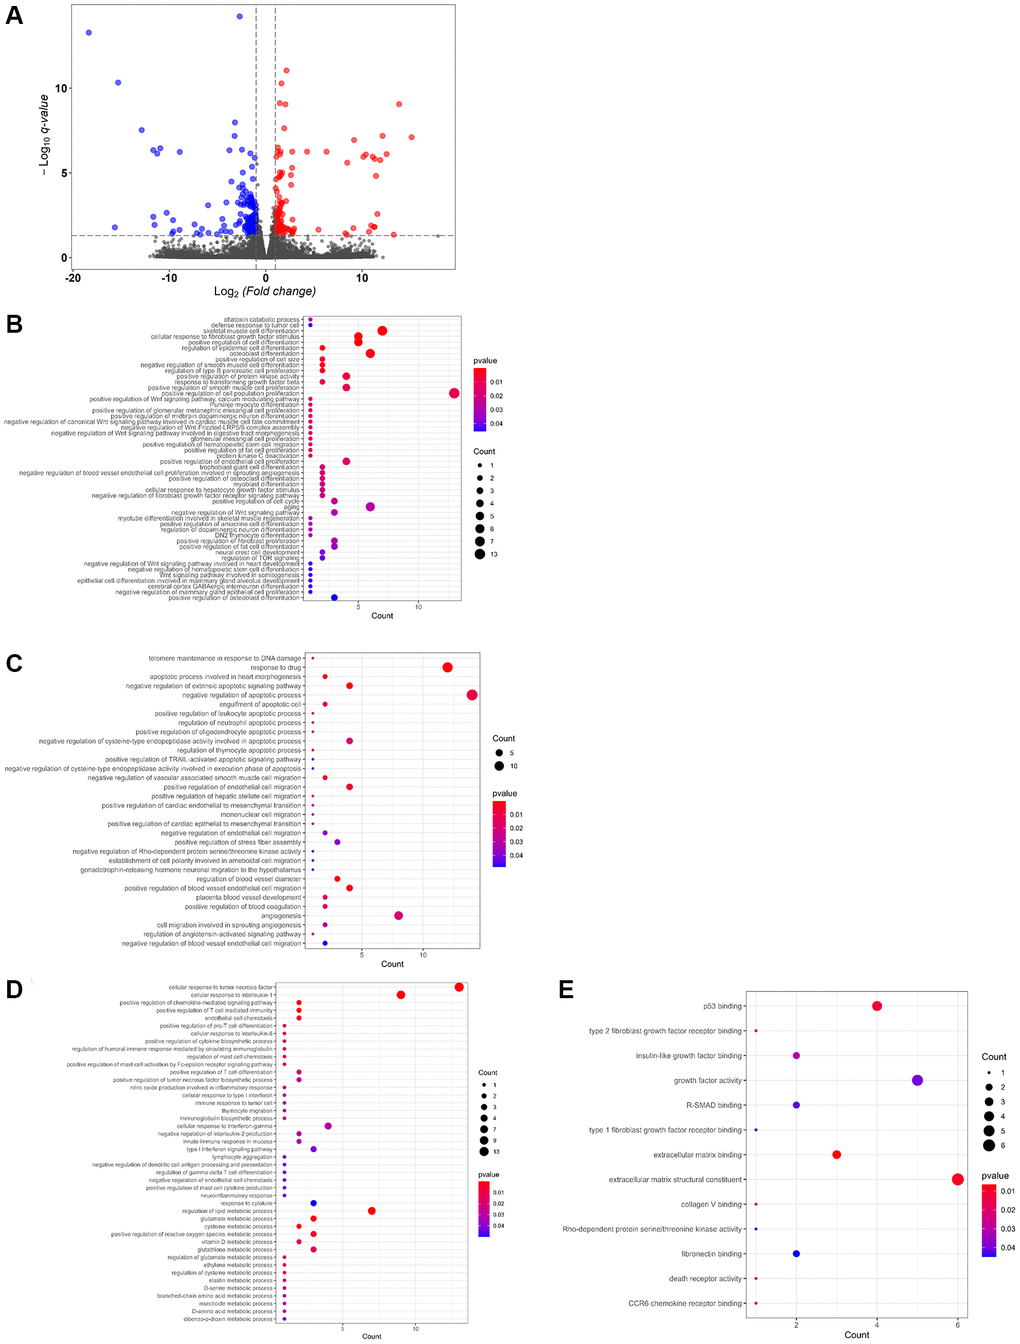
Figure 3.Differential gene expression controlled by USP44 in hepatocellular carcinoma (HCC) cells. (A) A volcano plot shows differential gene expression associated with USP44 overexpression in HepG2 cell. Blue dots = downregulated genes; red dots = upregulated genes; and grey dots = unchanged genes. The x-axis represents differential gene expression in a log2 ratio for the USP44-overexpressing cells compared with the control vector cells. The y-axis represents the q value for differential gene expression, comparing USP44-overexpressing cells with control vector cells. (B) Gene ontology enrichment analysis of USP44-mediated differentially expressed genes highlights the biologic processes related to cell proliferation and differentiation. Bubble diagrams show the biologic processes related (C) to DNA damage response, drug response, cell apoptosis, metastasis, and angiogenesis; (D) to the immune response and metabolism; and (E) to the binding and kinase activities related to cell growth, metastasis, and immune response controlled by USP44 in HCC cells. The size of the bubbles reflects the number of genes being controlled. The color of the bubble reflects the significance of the processes being controlled.