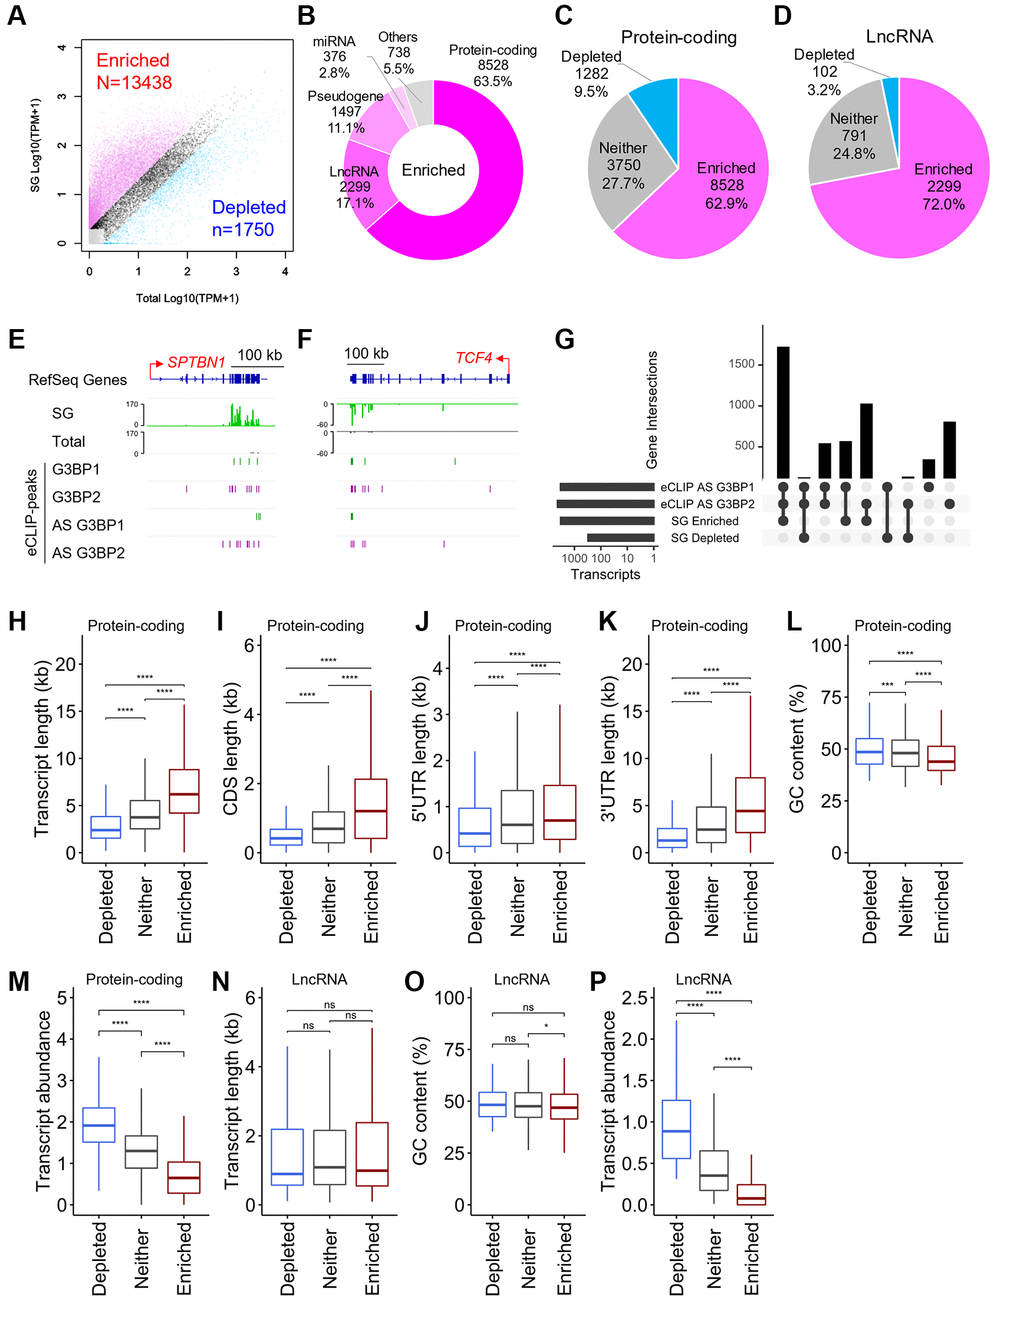
Figure 3.Physical basis of RNAs recruited to SGs. (A) Scatter plot depicting RNA abundance in SG purified RNAs and “Total” RNAs. Red dots indicate RNAs that are enriched (Fold change >2 and TPM of SG >1) in SG purified RNA compared to Total RNA. Blue dots indicate RNAs that are depleted (Fold change <0.5 and TPM of Total >1) in SG purified RNA compared to Total RNA. Dark gray dots indicate RNAs that are either not enriched or fail to meet the fold change requirement, referred to as “Neither.” Light gray dots indicate RNAs with TPM <1. (B) Pie chart depicting the relative contribution of gene categories for SG-enriched RNAs. (C, D) Pie chart depicting the relative contribution of each class of RNA (SG-enriched, SG-depleted, or “Neither”) for protein-coding genes (C) and lncRNAs (D), respectively. (E, F) Density profiles of normalized reads from SG RNA-seq (indicated in SG and Total) and eCLIP-seq peaks on SPTBN1 (E) and TCF4 (F). (G) Intersection across eCLIP-peaks of G3BP1- and G3BP2-bound RNAs, and SG-enriched and SG-depleted RNAs in AS treated SH-SY5Y cells. (H–P) Boxplots depicting total transcript length (H and N), CDS length (I), 5′UTR length (J), 3′UTR length (K), GC content (L and O), and abundance of RNA (M and P) of (H–M) protein-coding genes and (N–P) long non-coding RNAs (lncRNAs), respectively, for each of the three classes of mRNA localization during stress: SG enriched mRNAs, SG depleted mRNAs, or ”Neither”. Statistical significances were assessed by Wilcoxon rank sum test. ns: not significant, *p < 0.05, ***p < 0.001, ****p < 0.0001.