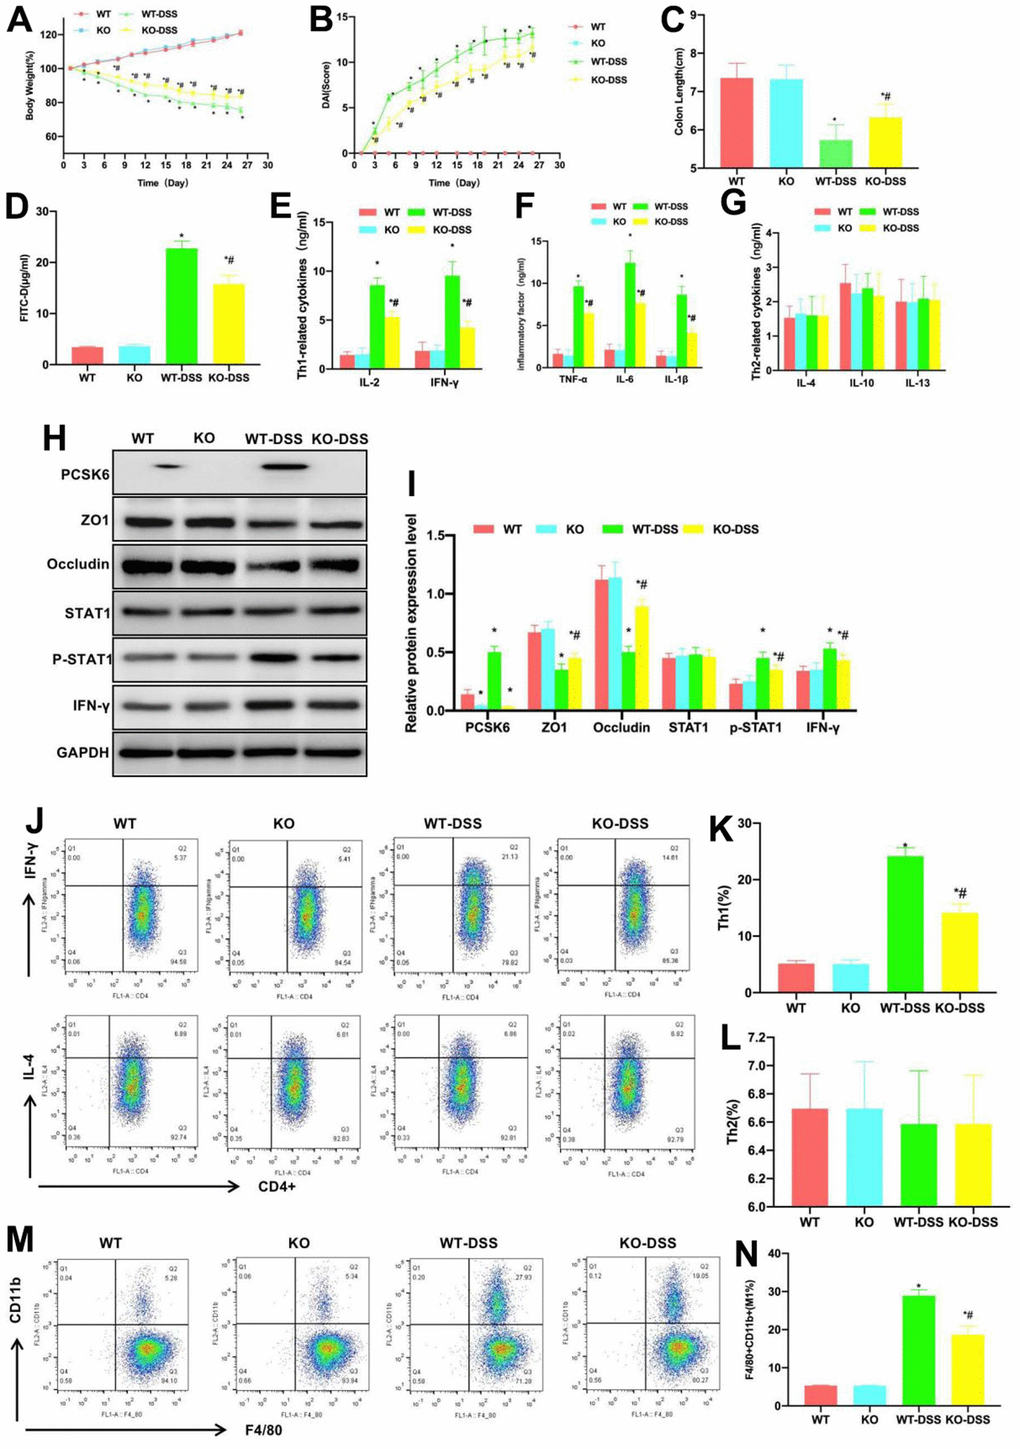
Figure 1.Effect of PCSK6 on mice with colitis. (A) Dynamic measurement of mouse body weight (n=10). Body weights of WT and KO mice gradually increased, while those of KO-DSS and WT-DSS groups gradually decreased, but KO-DSS group had notably less decreases relative to WT-DSS group, with difference being of significance. *P<0.05 vs. WT group, #P<0.05 vs. WT-DSS group. (B) DAI dynamic scores (n=10). The DAI scores of KO-DSS and WT-DSS groups gradually increased, but those in WT and KO remained largely unchanged, and the score of KO-DSS group was lower than WT-DSS group at corresponding time point, with significant difference. *P<0.05 vs. WT group, #P<0.05 vs. WT-DSS group. (C) Comparison of mouse intestinal length (n=10). Intestinal tissue lengths in KO-DSS and WT-DSS groups decreased relative to WT and KO groups, but KO-DSS group had increased length relative to WT-DSS group. *P<0.05 vs. WT group, #P<0.05 vs. WT-DSS group. (D) FITC-D (n=10). Serum FITC-D contents in WT and KO mice were lower, while those of WT-DSS and KO-DSS mice significantly increased, and those of KO-DSS mice decreased relative to WT-DSS mice. *P<0.05 in relative to WT group, #P<0.05 in relative to WT-DSS group. (E–G) ELISA (n=10). IL-6, IFN-γ, IL-4, TNF-α and IL-1β contents of WT and KO groups were lower, while these contents in KO-DSS and WT-DSS mice significantly increased compared with WT and KO mice, but their contents within KO-DSS mice decreased relative to WT-DSS mice. Differences in the Th2 cells-related factors among the four groups were not significant. *P<0.05 vs. WT group, #P<0.05 vs. WT-DSS group. (H, I) Relative protein level (n=5). PCSK6 was not significantly expressed in KO or KO-DSS group. ZO1 and Occludin expression of KO and WT groups increased, and their levels of KO-DSS and WT-DSS groups were markedly down-regulated. p-STAT1 expression in KO-DSS mice notably decreased relative to WT-DSS mice. *P<0.05 vs. WT group, #P<0.05 vs. WT-DSS group. (J–N) Th1, Th2 cells and M1 macrophages did not exhibit significant differences in WT versus KO groups, and low proportions could be detected, while Th1 cells and M1 macrophages proportions in WT-DSS and KO-DSS groups significantly increased relative to WT and KO groups. However, Th2 cell proportion remained largely unchanged, while Th1 cells and M1 macrophages proportions of KO-DSS group decreased compared with WT-DSS group. *P<0.05 vs. WT group, #P<0.05 vs. WT-DSS group.