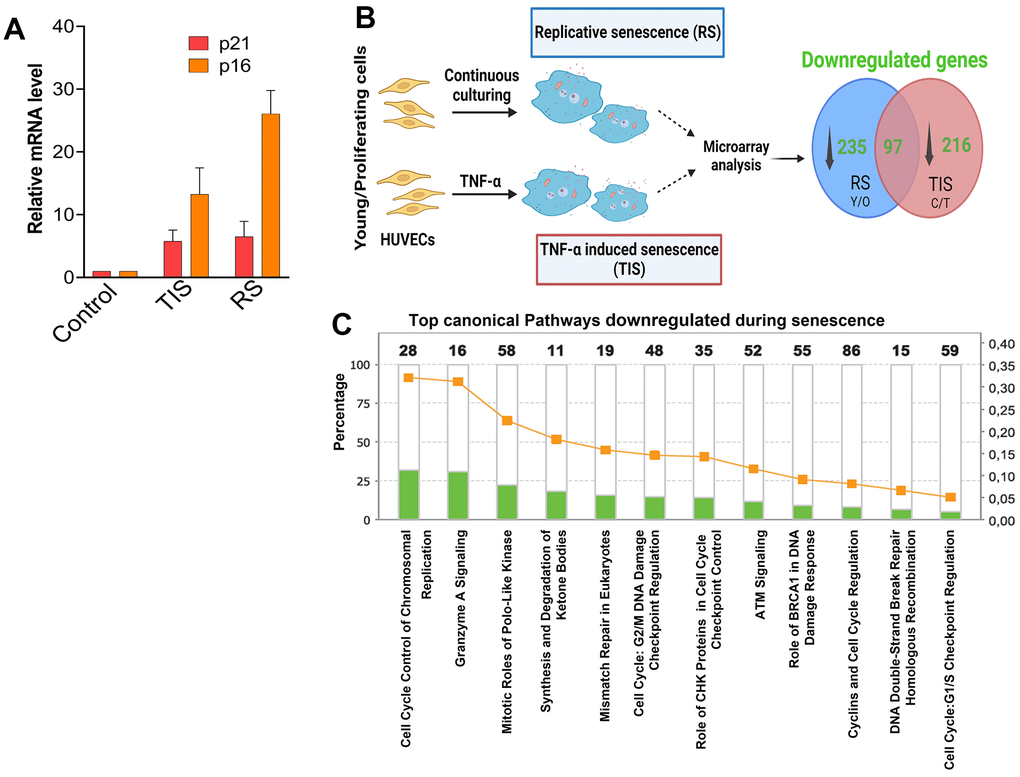
Figure 1.Microarray analysis of replicative and TNF-α induced senescence. (A) Expression of p21 and p16 in cells senesced by replicative stress or by exposure to TNF-α. (B) Experimental design for microarray analysis. Early passage or control HUVECs were continuously cultured until proliferative arrest to achieve replicative senescence (RS) or treated with the proinflammatory cytokine TNF-α (TIS) to achieve cytokine induced senescence. Gene expression changes of early passage control vs. replicative senescence and control vs. TNF-α-induced senescence were determined by microarray analysis. Venn diagram illustrating the number of genes downregulated in replicative senescence and TNF-α-induced senescence and overlap between the two groups (created with BioRender.com). (C) Top canonical pathways altered in senescence. Ingenuity Pathway Analysis (IPA) showing top canonical pathways associated to downregulated genes in senescence. The stacked bar chart displays the percentages of genes that were downregulated while the numerical value on top of each bar represents the number of genes associated with each canonical pathway. Green denotes downregulated gene expression.