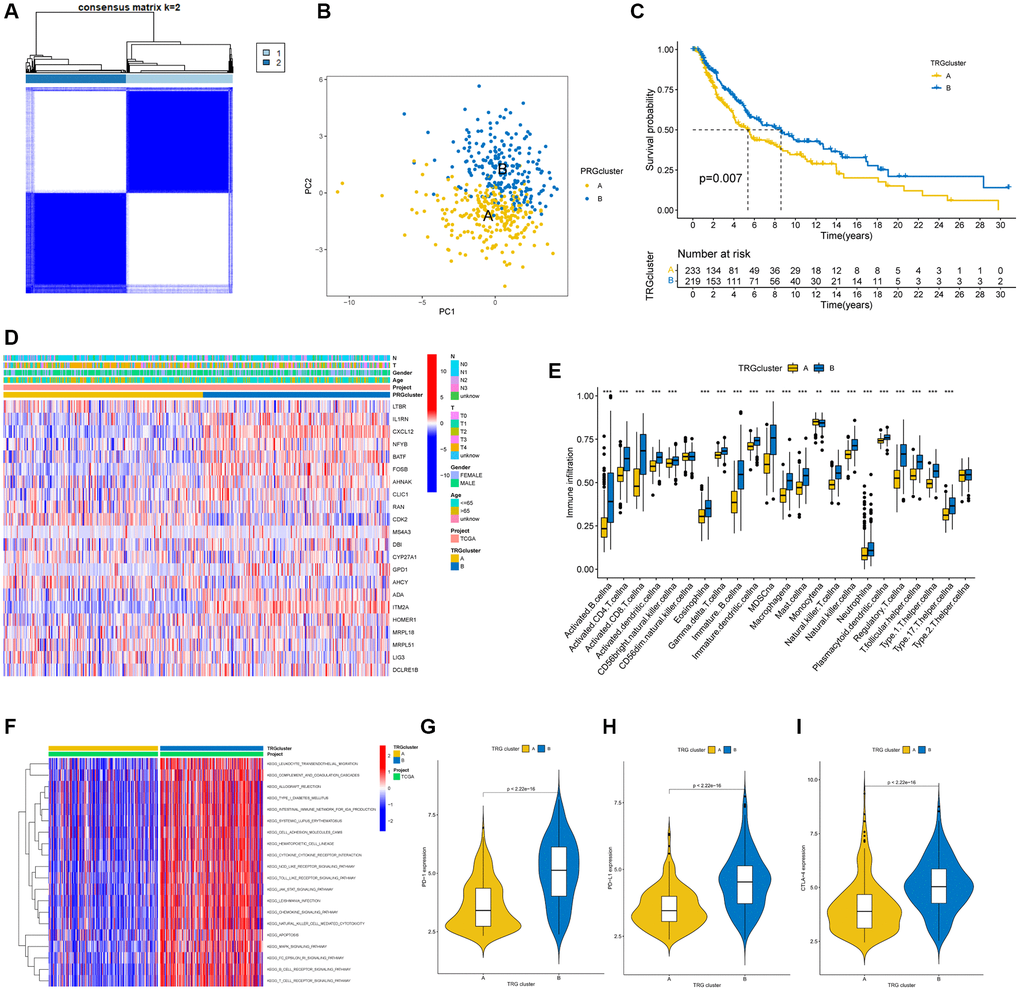
Figure 3.TRG clusters in melanoma samples and clinical characteristics, tumor microenvironment between two clusters. (A) Two TRG clusters were identified using consensus clustering analysis. (B) PCA demonstrated a great difference between the two TRG clusters. (C) The K-M curve illustrated the difference in survival time between the two TRG molecular clusters (p = 0.007); (D) Heatmaps demonstrated the distinctions between TRG clusters in clinical features and TRGs expression in SKCM patients. (E) Different immune cell infiltration between the two molecular clusters. (F) GSVA showed the enriched pathways in TRG clusters, in which red and blue represent activated and inhibited pathways, respectively. (G–I) Expression of PD-1, PD-L1, and CTLA-4 in the two TRG clusters. **p < 0.01; ***p < 0.001.