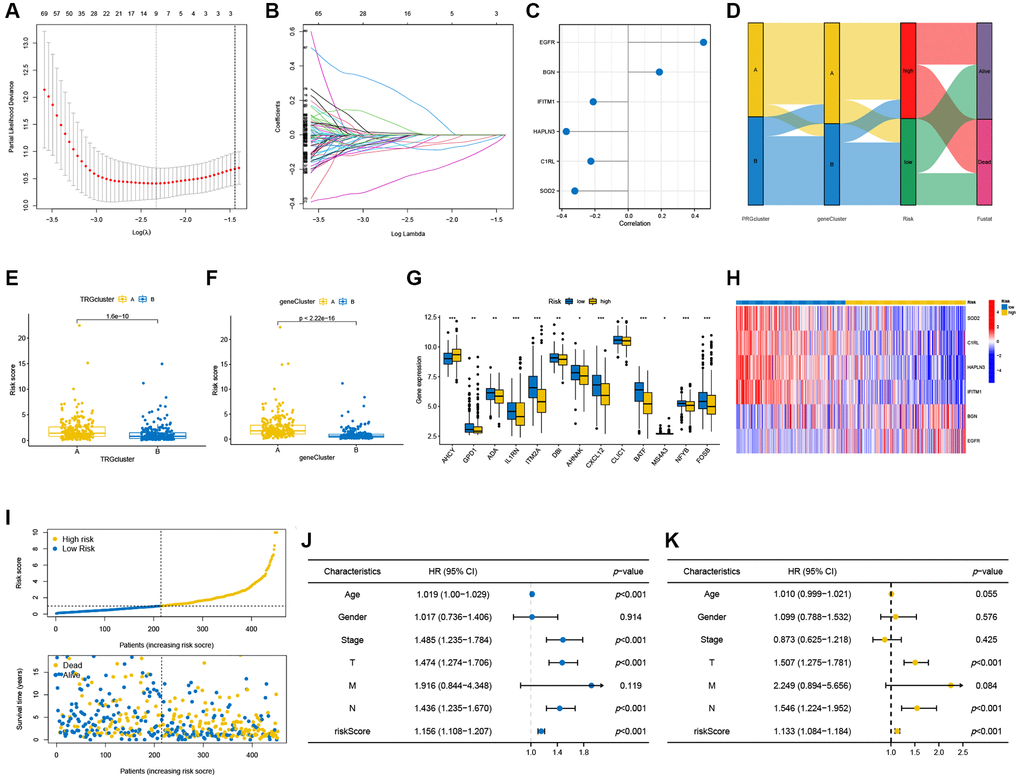
Figure 5.Construction of the prognostic model. (A, B) The LASSO regression analysis and partial likelihood deviance on the prognostic genes. (C) Forest plot of the multivariate cox regression analysis for the six signature genes. (D) Sankey diagram demonstrated the distribution of TRG subtypes, gene subtypes, risk groups and survival status in SKCM patients. (E, F) Differences in risk score between the two TRG clusters and two gene clusters. (G) Differences in expression levels of TRGs in the two risk groups. (H) Heatmap illustrating the expression of six signature genes in the two risk groups in the testing cohort. (I) Risk score and survival outcome of each sample. Forest plots of univariate (J) and multivariate (K) Cox regression analyses in SKCM patients. *p < 0.05; **p < 0.01; ***p < 0.001.