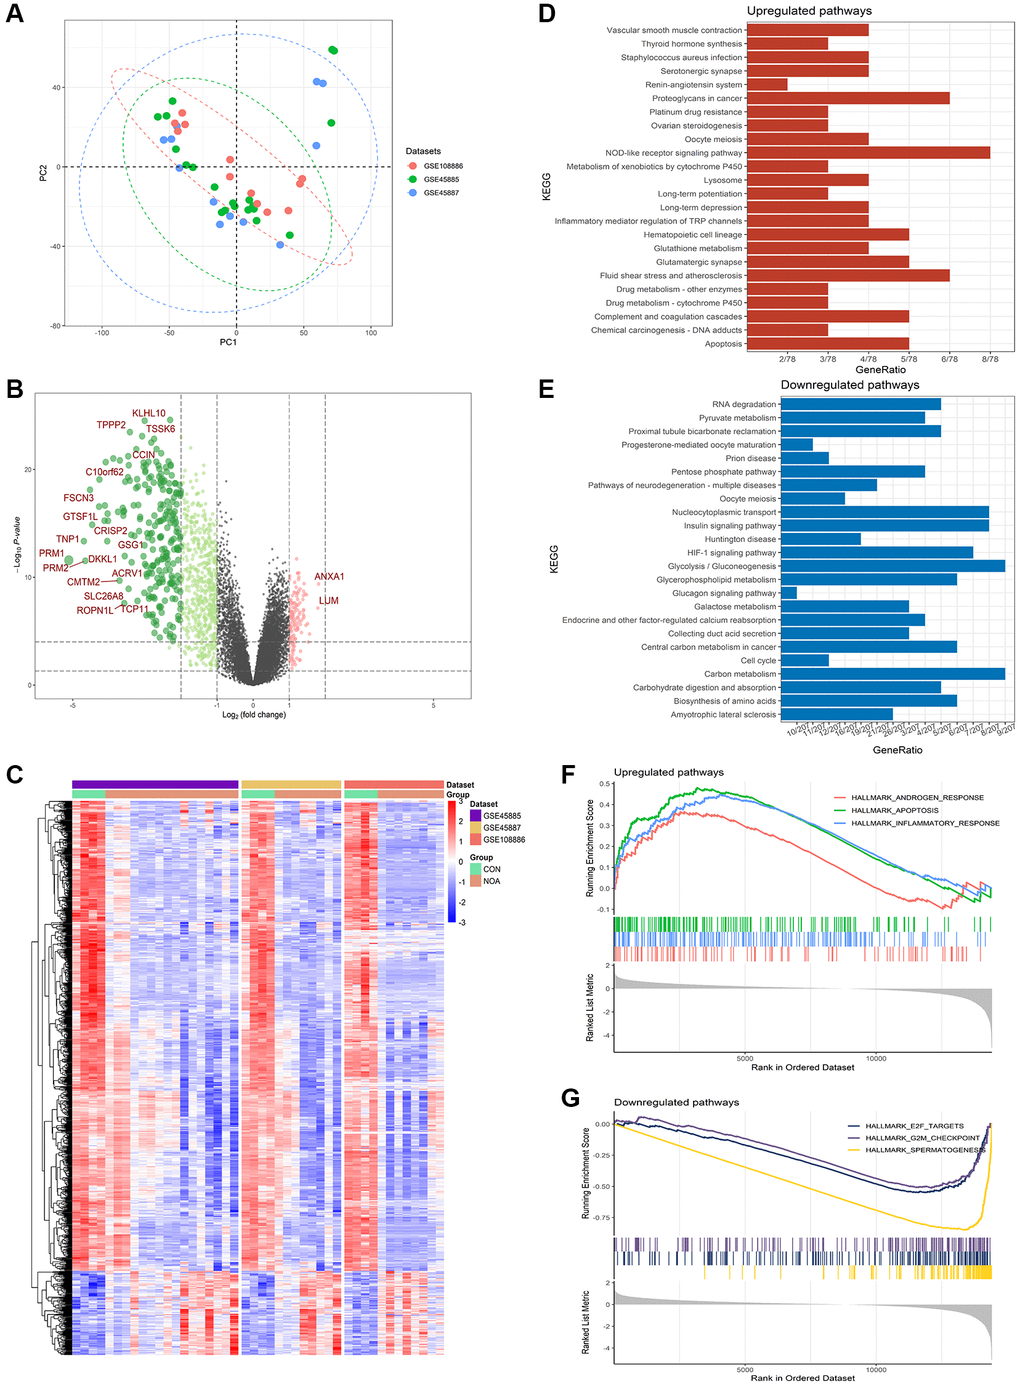
Figure 2.Differentially expressed genes in NOA versus control. (A) PCA plot of training datasets. (B) Volcano plot for the DEGs. (C) Heatmap for the DEGs. (D) KEGG analysis of upregulated pathways. (E) KEGG analysis of downregulated pathways. (F) GSEA analysis of upregulated pathways. (G) GSEA analysis of downregulated pathways. (P < 0.05, Abbreviations: NOA: non-obstructive azoospermia; CON: control group).