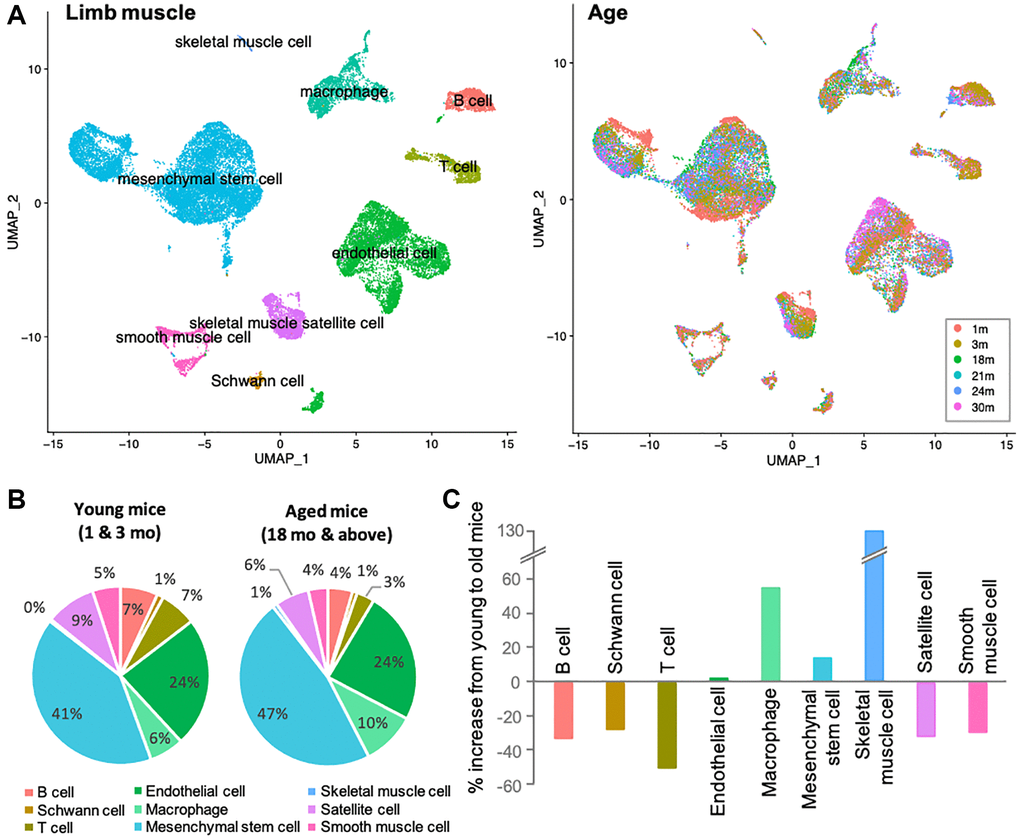
Figure 1.Immune senescence is one of the most apparent signatures in skeletal muscle aging. (A) UMAP representation of single-cell expression in limb muscles of mice of different age groups. Left UMAP indicates each cellular annotation. Right UMAP shows the cellular compositions of each age group. (B) Pie charts shows the percentage of various cells in the limb muscles of young mice (1 and 3-mo-old) and old mice (≥18-mo-old). Color coordination of cell types is consistent to left UMAP in (A). (C) Bar graph shows the % increase from 3-mo to 18-mo. B and T cells, Schwann cells, satellite cells and smooth muscle cells were reduced, while macrophages and mesenchymal stem cell increased. Note that the marked increase in skeletal muscle cells was due to a difference of 0% to 1%, and should be ignored from the data interpretation. Color coordination of cell types is consistent to left UMAP in (A).