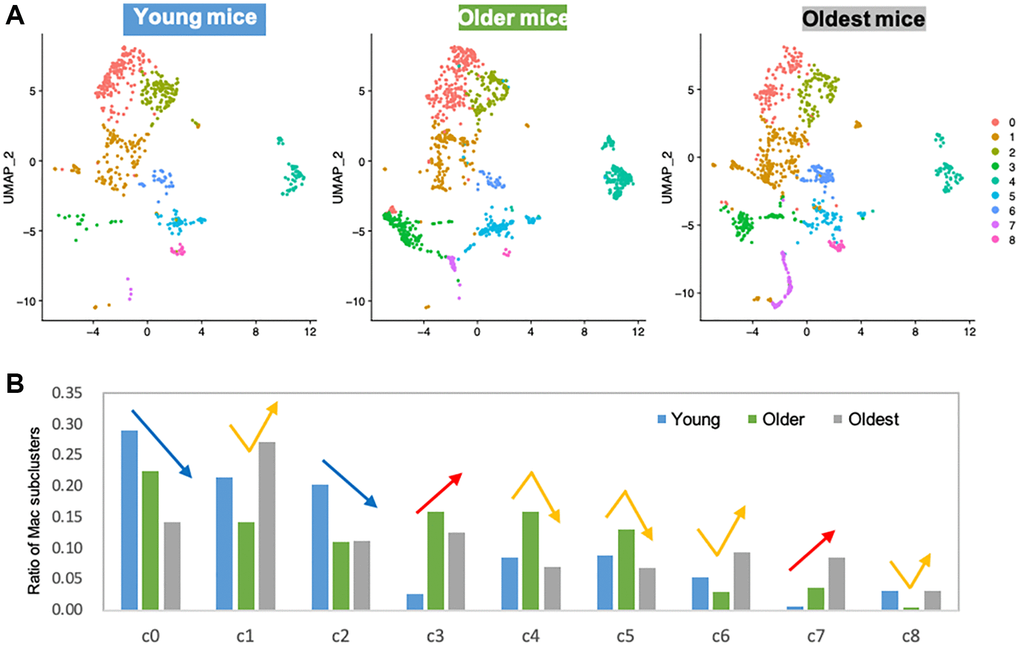
Figure 2.Subclustering of macrophages shows clear trends of age-related decrease or increase. (A) UMAP representation of macrophage subclusters in three age groups. Young mice: 1 and 3 mo. old, Older mice: 18 and 21 mo. old, Oldest mice: 24 and 30 mo. old. (B) Bar graph shows the ratio of individual subcluster macrophages present in each age group. Blue/red arrows are indicated on subclusters that had age-associated decrease/increase. Yellow arrows are indicated on subclusters that showed middle-age-specific tendency.