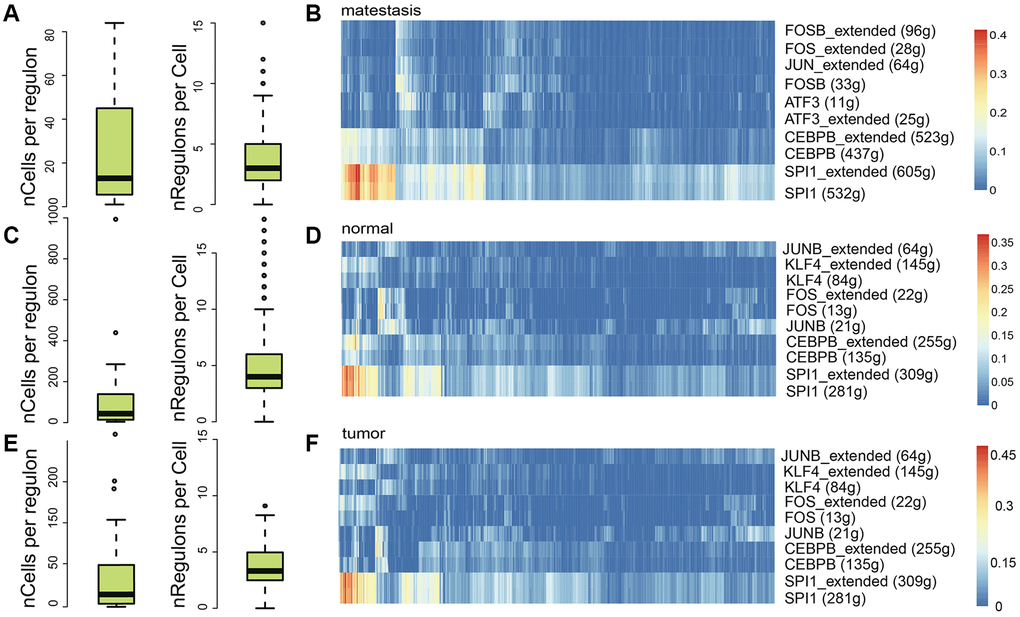
Figure 6.Regulatory element analysis with SCENIC in different sample classes. The number of cells per regulon and the regulon activity in metastasis (A, B), normal (C, D), and tumor (E, F) samples, respectively.
Figure 6 — Heterogeneity of tumor immune microenvironment in malignant and metastatic change in LUAD is revealed by single-cell RNA sequencing | Aging