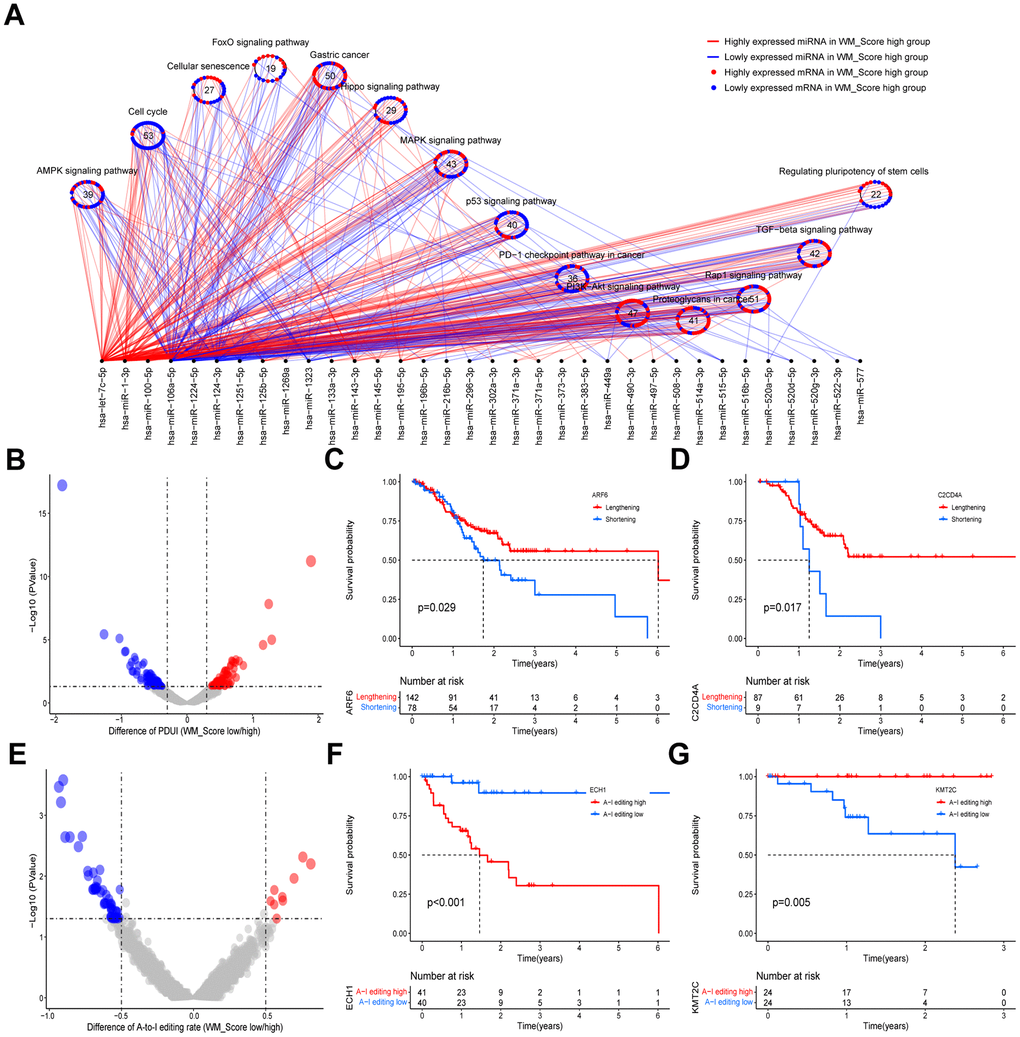
Figure 8.Relationships between WM_Score and transcriptional and post-transcriptional regulation. (A) Differentially expressed miRNAs and their associated pathways between WM_Score high and low groups. Red lines and dots represent highly expressed genes in the WM_Score high group; blue lines and dots represent highly expressed genes in the WM_Score low group. Circles represent targeted mRNA-enriched pathways. (B) Differences in the percentage of Distal poly(A) site Usage Index (PDUI) of the genes between WM_Score high and low groups. Red, PDUI lengthened genes in WM_Score high group; blue, PDUI shortened genes in WM_Score high group; grey, genes with no significant difference in PDUI. (C, D) Kaplan–Meier curves showing the overall survival status of PDUI lengthening (red) and PDUI shortening (blue) of ARF6 (C) and C2CD4A (D). (E) Differences of A-I editing frequency of genes between WM_Score high and low groups. Red, high A-I editing genes in the WM_Score high group; blue, low A-I editing genes in WM_Score high group; grey, genes with no significant difference in A-I editing. (F, G) Kaplan–Meier curves showing the overall survival status of A-I editing high (red) and A-I editing low (blue) of gene ECH1 (F) and SAMHD1 (G).