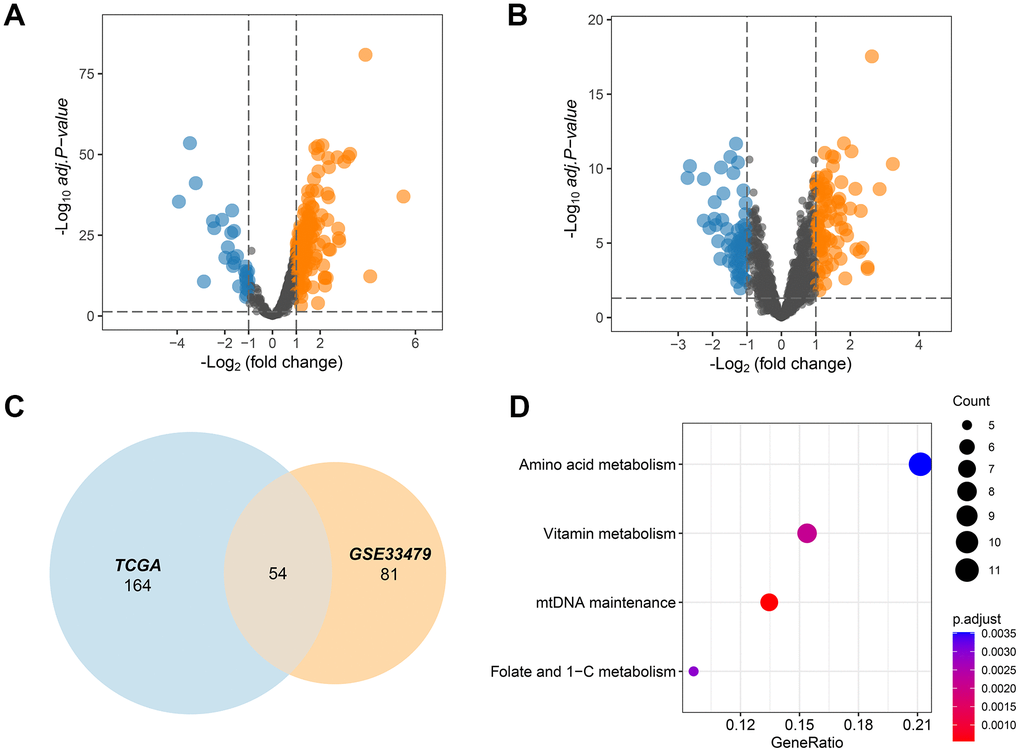
Figure 1.MMRGs identification in LUAD. (A, B) Volcano plots of the differentially expressed MMRGs in the TGCA and GSE33479 database. (C) Venn diagram of differentially expressed MMRGs in TGCA and GSE33479. (D) KEGG pathway enrichment analysis of 54 pivotal MMRGs.