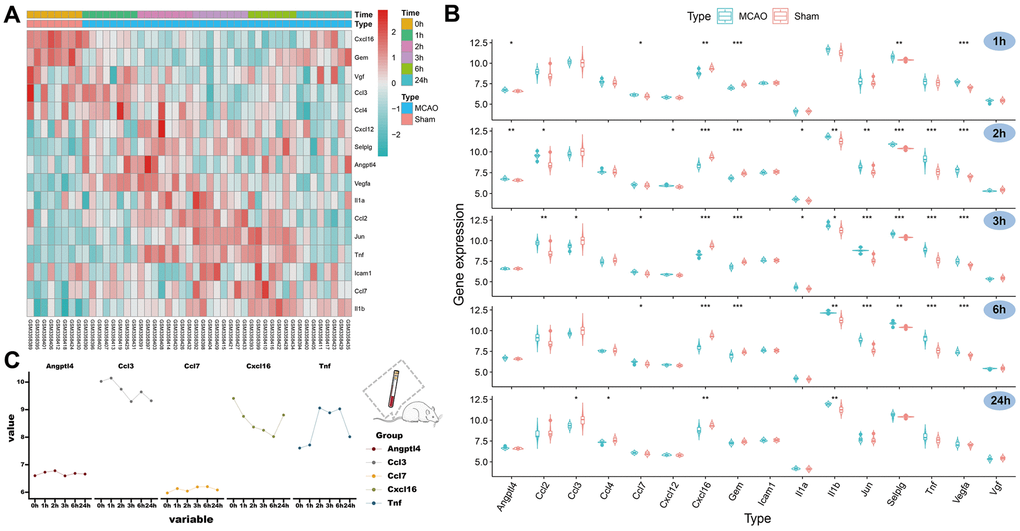
Figure 3.Expression of SRGs in the rat peripheral blood and identification of HSRGs. (A) The heatmap for SRGs in GSE119121 at different time points. (B) The violin plot for SRGs in GSE119121. (C) The line graph describes the variation trend of HSRGs expression at different time points.