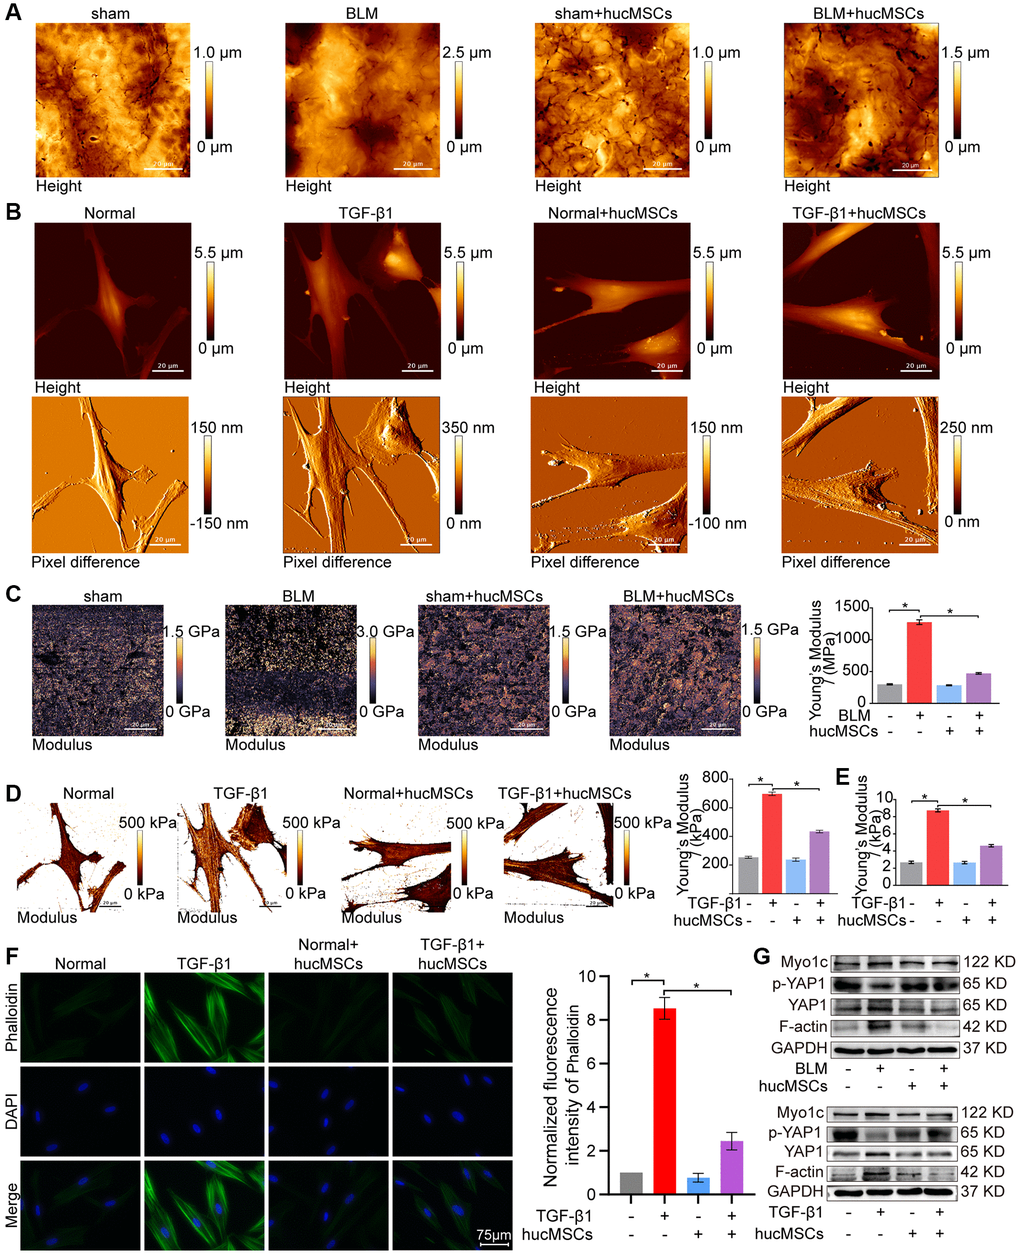
Figure 4.hucMSCs treatment weakened mechanical stiffness in pulmonary fibrosis. (A) AFM images showed that the surface of lung tissues was smooth in the sham group. BLM caused the lung surface to become rough and increased the lung tissue thickness. hucMSCs treatment improved lung tissue morphology. (B) AFM images displayed that the cells were spindle shaped with smooth surface in the normal group. After TGF-β1 stimulation, the cells became elongated and flat and their cell height/roughness increased. hucMSCs treatment improved the cell state. Stress fibers arranged in parallel along the main axis of cells were found in the TGF-β1 group. After hucMSCs intervention, these fibers were reduced. (C) Young’s modulus value increased in the BLM group compared with that in the sham group, and hucMSCs treatment decreased the Young’s modulus. The average Young’s modulus was 299.017 ± 21.021 MPa in the sham group, 1275.667 ± 89.502 MPa in the BLM group, 284.667 ± 18.778 MPa in the sham+hucMSCs group, and 471.183 ± 29.462 MPa in the BLM+hucMSCs group. (D) Young’s modulus increased in the TGF-β1 group compared with that in the normal group, and hucMSCs treatment decreased the Young’s modulus. The average Young's modulus was 254.583 KPa in the normal group, 697.217 KPa in the TGF-β1 group, 238.150 KPa in the normal+hucMSCs group, and 434.150 KPa in the TGF-β1+hucMSCs group. (E) Tests using colloid probe with ball stuck pressed cells were conducted to determine the reaction forces of cells based on Young’s modulus. The average Young’s modulus was 2.686 ± 0.349 KPa in the normal group, 8.742 ± 0.422 KPa in the TGF-β1 group, 2.660 ± 0.333 KPa in the normal+hucMSCs group, and 4.623 ± 0.349 KPa in the TGF-β1+hucMSCs group. (F) Cytoskeleton staining with FITC-phalloidin depicted that the cytoskeleton tension was aggravated by TGF-β1 treatment and alleviated by hucMSCs treatment. (G) hucMSCs treatment decreased YAP1, Myo1c, and F-actin expression and increased p-YAP1 expression in BLM-induced mice model and TGF-β1-activated cell model. Each bar represents the mean ± SD; n = 6; *p < 0.05.