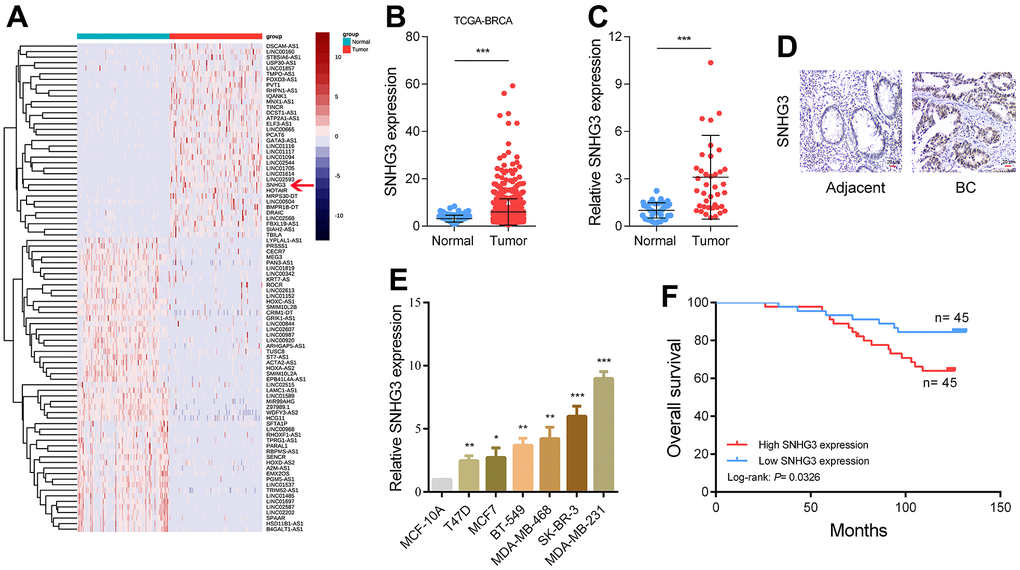
Figure 1.SNHG3 expression is upregulated in BC and high SNHG3 expression predicts poor prognosis. (A) Hierarchical cluster heat map of aberrantly expressed lncRNAs in BC generated from RNA sequencing data from the TCGA database. Red in the heat map denotes upregulation, while blue denotes downregulation. The red line indicates SNHG3. (B) Expression of SNHG3 in TCGA BC cohorts. (C) qRT-PCR analysis of SNHG3 expression in 40 pairs of BC and corresponding normal tissues. (D) ISH analysis of SNHG3 expression in BC and corresponding normal tissues. (E) SNHG3 expression in BC cell lines (T470, MCF7, BT-549, MDA-MB-468, SK-BR-3 and MDA-MB-231) compared with normal breast epithelial cell line MCF-10A detected by qRT-PCR. (F) Kaplan–Meier survival analysis of BC patients’ overall survival based on their SNHG3 expression.